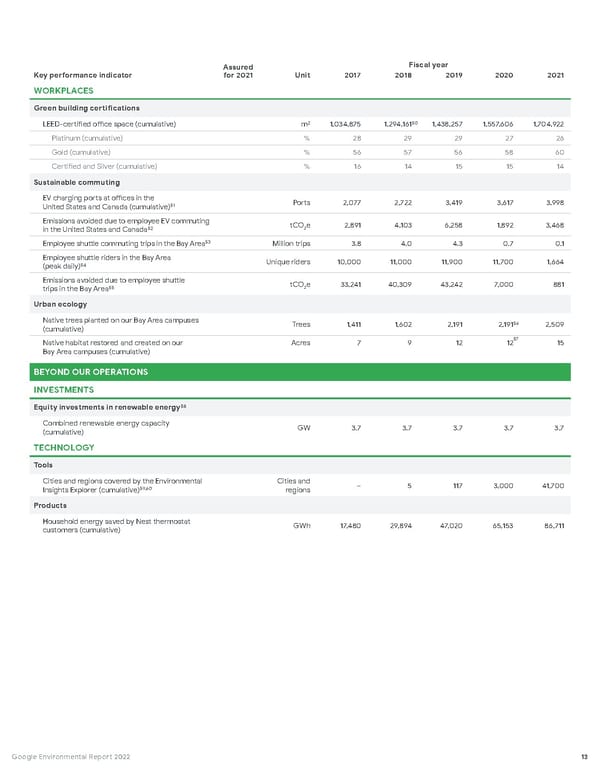
Key performance indicator Assured for 2021 Unit Fiscal year 2017 2018 2019 2020 2021 WORKPLACES Green building certifications LEED-certified office space (cumulative) m 2 1,034,875 1,294,161 50 1,438,257 1,557,606 1,704,922 Platinum (cumulative) % 28 29 29 27 26 Gold (cumulative) % 56 57 56 58 60 Certified and Silver (cumulative) % 16 14 15 15 14 Sustainable commuting EV charging ports at offices in the United States and Canada (cumulative) 51 Ports 2,077 2,722 3,419 3,617 3,998 Emissions avoided due to employee EV commuting in the United States and Canada 52 tCO 2 e 2,891 4,103 6,258 1,892 3,468 Employee shuttle commuting trips in the Bay Area 53 Million trips 3.8 4.0 4.3 0.7 0.1 Employee shuttle riders in the Bay Area (peak daily) 54 Unique riders 10,000 11,000 11,900 11,700 1,664 Emissions avoided due to employee shuttle trips in the Bay Area 55 tCO 2 e 33,241 40,309 43,242 7,000 881 Urban ecology Native trees planted on our Bay Area campuses (cumulative) Trees 1,411 1,602 2,191 2,191 56 2,509 Native habitat restored and created on our Bay Area campuses (cumulative) Acres 7 9 12 12 57 15 BEYOND OUR OPERATIONS INVESTMENTS Equity investments in renewable energy 58 Combined renewable energy capacity (cumulative) GW 3.7 3.7 3.7 3.7 3.7 TECHNOLOGY Tools Cities and regions covered by the Environmental Insights Explorer (cumulative) 59 , 60 Cities and regions – 5 117 3,000 41,700 Products Household energy saved by Nest thermostat customers (cumulative) GWh 17,480 29,894 47,020 65,153 86,711 13 Google Environmental Report 2022
 Google Environmental Report Page 13 Page 15