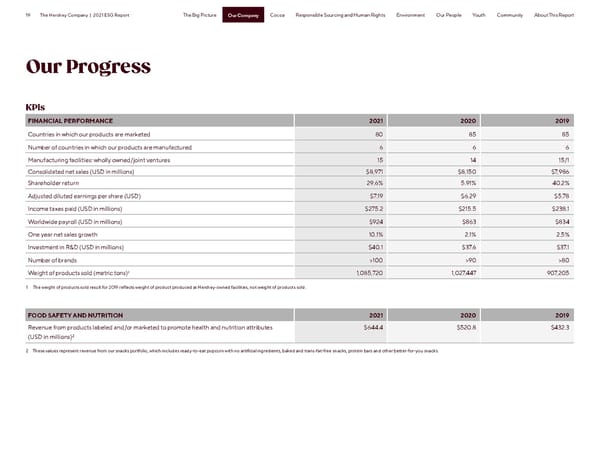
19 The Hershey Company | 2021 ESG Report The Big Picture Our Company Cocoa Responsible Sourcing and Human Rights Environment Our People Youth Community About This Report Our Company Our Progress KPIs FINANCIAL PERFORMANCE 2021 2020 2019 Countries in which our products are marketed 80 85 85 Number of countries in which our products are manufactured 6 6 6 Manufacturing facilities: wholly owned/joint ventures 15 14 15/1 Consolidated net sales (USD in millions) $8,971 $8,150 $7,986 Shareholder return 29.6% 5.91% 40.2% Adjusted diluted earnings per share (USD) $7.19 $6.29 $5.78 Income taxes paid (USD in millions) $275.2 $215.5 $238.1 Worldwide payroll (USD in millions) $924 $863 $834 One year net sales growth 10.1% 2.1% 2.5% Investment in R&D (USD in millions) $40.1 $37.6 $37.1 Number of brands >100 >90 >80 1 Weight of products sold (metric tons) 1,085,720 1,027,447 907,205 1 The weight of products sold result for 2019 reflects weight of product produced at Hershey-owned facilities, not weight of products sold. FOOD SAFETY AND NUTRITION 2021 2020 2019 Revenue from products labeled and/or marketed to promote health and nutrition attributes $644.4 $520.8 $432.3 2 (USD in millions) 2 These values represent revenue from our snacks portfolio, which includes ready-to-eat popcorn with no artificial ingredients, baked and trans-fat-free snacks, protein bars and other better-for-you snacks.
 Hershey ESG Report Page 18 Page 20