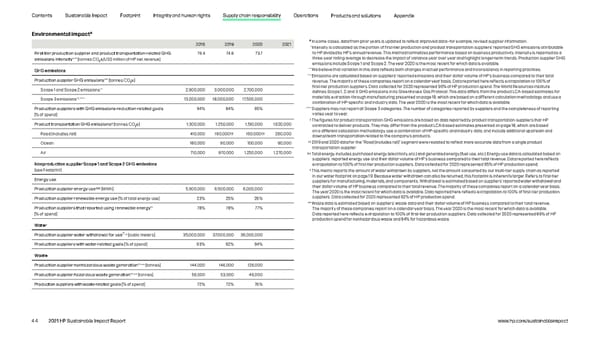
Contents Sustainable Impact Footprint Integrity and human rights Supply chain responsibility Operations Products and solutions Appendix # Environmental impact # 2018 2019 2020 2021 In some cases, data from prior years is updated to reflect improved data—for example, revised supplier information. * Intensity is calculated as the portion of first-tier production and product transportation suppliers’ reported GHG emissions attributable First-tier production supplier and product transportation-related GHG 76.4 74.8 73.7 to HP divided by HP’s annual revenue. This method normalizes performance based on business productivity. Intensity is reported as a , three-year rolling average to decrease the impact of variance year over year and highlight longer-term trends. Production supplier GHG emissions intensity*** [tonnes CO e/US$ million of HP net revenue] 2 emissions include Scope 1 and Scope 2. The year 2020 is the most recent for which data is available. ** GHG emissions We believe that variation in this data reflects both changes in actual performance and inconsistency in reporting practices. *** Emissions are calculated based on suppliers’ reported emissions and their dollar volume of HP’s business compared to their total *** Production supplier GHG emissions [tonnes CO2e] revenue. The majority of these companies report on a calendar-year basis. Data reported here reflects extrapolation to 100% of first-tier production suppliers. Data collected for 2020 represented 96% of HP production spend. The World Resources Institute ** Scope 1 and Scope 2 emissions 2,900,000 3,000,000 2,700,000 defines Scope 1, 2, and 3 GHG emissions in its Greenhouse Gas Protocol. This data differs from the product LCA-based estimates for , materials extraction through manufacturing presented on page 18, which are based on a different calculation methodology and use a Scope 3 emissions** **** 13,200,000 18,000,000 17,500,000 combination of HP-specific and industry data. The year 2020 is the most recent for which data is available. **** Production suppliers with GHG emissions-reduction-related goals 94% 94% 95% Suppliers may not report all Scope 3 categories. The number of categories reported by suppliers and the completeness of reporting [% of spend] varies year to year. † The figures for product transportation GHG emissions are based on data reported by product transportation suppliers that HP Product transportation GHG emissions† [tonnes CO2e] 1,300,000 1,250,000 1,510,000 1,620,000 contracted to deliver products. They may differ from the product LCA-based estimates presented on page 18, which are based Road (includes rail) 410,000 190,000†† 160,000†† 260,000 on a different calculation methodology, use a combination of HP-specific and industry data, and include additional upstream and downstream transportation related to the company’s products. †† Ocean 180,000 90,000 100,000 90,000 2019 and 2020 data for the “Road (includes rail)” segment were restated to reflect more accurate data from a single product transportation supplier. Air 710,000 970,000 1,250,000 1,270,000 ††† Total energy includes purchased energy (electricity, etc.) and generated energy (fuel use, etc.). Energy use data is calculated based on suppliers’ reported energy use and their dollar volume of HP’s business compared to their total revenue. Data reported here reflects Nonproduction supplier Scope 1 and Scope 2 GHG emissions extrapolation to 100% of first-tier production suppliers. Data collected for 2020 represented 95% of HP production spend. (see Footprint) ^ This metric reports the amount of water withdrawn by suppliers, not the amount consumed by our multi-tier supply chain as reported Energy use in our water footprint on page 19. Because water withdrawn can also be returned, this footprint is inherently larger. Refers to first-tier suppliers for manufacturing, materials, and components. Withdrawal is estimated based on suppliers’ reported water withdrawal and ††† their dollar volume of HP business compared to their total revenue. The majority of these companies report on a calendar-year basis. Production supplier energy use [MWh] 5,900,000 6,500,000 6,000,000 The year 2020 is the most recent for which data is available. Data reported here reflects extrapolation to 100% of first-tier production Production supplier renewable energy use [% of total energy use] 23% 25% 26% suppliers. Data collected for 2020 represented 92% of HP production spend. ^^ Waste data is estimated based on suppliers’ waste data and their dollar volume of HP business compared to their total revenue. ** Production suppliers that reported using renewable energy 78% 78% 77% The majority of these companies report on a calendar-year basis. The year 2020 is the most recent for which data is available. [% of spend] Data reported here reflects extrapolation to 100% of first-tier production suppliers. Data collected for 2020 represented 89% of HP production spend for nonhazardous waste and 84% for hazardous waste. Water , ** ^ Production supplier water withdrawal for use [cubic meters] 35,000,000 37,000,000 36,000,000 Production suppliers with water-related goals [% of spend] 93% 92% 94% Waste , ** ^^ Production supplier nonhazardous waste generation [tonnes] 144,000 146,000 126,000 , ** ^^ Production supplier hazardous waste generation [tonnes] 56,000 53,000 46,000 Production suppliers with waste-related goals [% of spend] 72% 72% 76% 44 2021 HP Sustainable Impact Report www.hp.com/sustainableimpact
 HP Sustainable Impact Report Page 43 Page 45