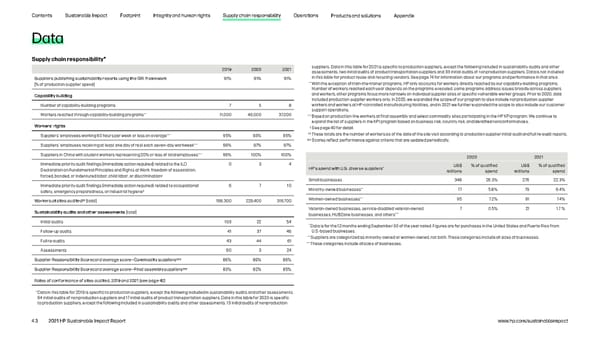
Contents Sustainable Impact Footprint Integrity and human rights Supply chain responsibility Operations Products and solutions Appendix Data Supply chain responsibility* 2019 2020 2021 suppliers. Data in this table for 2021 is specific to production suppliers, except the following included in sustainability audits and other assessments: two initial audits of product transportation suppliers and 33 initial audits of nonproduction suppliers. Data is not included Suppliers publishing sustainability reports using the GRI framework 91% 91% 91% in this table for product reuse and recycling vendors. See page 74 for information about our programs and performance in that area. ** [% of production supplier spend] With the exception of train-the-trainer programs, HP only accounts for workers directly reached by our capability-building programs. Number of workers reached each year depends on the programs executed: some programs address issues broadly across suppliers Capability building and workers; other programs focus more narrowly on individual supplier sites or specific vulnerable worker groups. Prior to 2020, data included production supplier workers only. In 2020, we expanded the scope of our program to also include nonproduction supplier Number of capability-building programs 7 5 8 workers and workers at HP-controlled manufacturing facilities, and in 2021 we further expanded the scope to also include our customer support operations. Workers reached through capability-building programs** 11,000 46,000 37,000 *** Based on production-line workers at final assembly and select commodity sites participating in the HP KPI program. We continue to expand the list of suppliers in the KPI program based on business risk, country risk, and identified nonconformances. Workers’ rights † See page 40 for detail. Suppliers’ employees working 60 hours per week or less on average*** 95% 93% 95% †† These totals are the number of workers as of the date of the site visit according to production supplier initial audit and full re-audit reports. ††† Scores reflect performance against criteria that are updated periodically. Suppliers’ employees receiving at least one day of rest each seven-day workweek*** 99% 97% 97% Suppliers in China with student workers representing 20% or less of total employees*** 99% 100% 100% 2020 2021 Immediate priority audit findings (immediate action required) related to the ILO 0 3 4 US$ % of qualified US$ % of qualified Declaration on Fundamental Principles and Rights at Work: freedom of association; HP’s spend with U.S. diverse suppliers* millions spend millions spend forced, bonded, or indentured labor; child labor; or discrimination† Small businesses 348 26.3% 276 22.3% Immediate priority audit findings (immediate action required) related to occupational 6 7 10 ** safety, emergency preparedness, or industrial hygiene† Minority-owned businesses 77 5.8% 79 6.4% ** †† Women-owned businesses 95 7.2% 91 7.4% Workers at sites audited [total] 198,300 229,400 316,700 Sustainability audits and other assessments [total] Veteran-owned businesses, service-disabled veteran-owned 7 0.5% 21 1.7 % businesses, HUBZone businesses, and others*** Initial audits 103 22 54 * Data is for the 12 months ending September 30 of the year noted. Figures are for purchases in the United States and Puerto Rico from Follow-up audits 41 37 46 U.S.-based businesses. ** Full re-audits 43 44 61 Suppliers are categorized as minority-owned or women-owned, not both. These categories include all sizes of businesses. *** These categories include all sizes of businesses. Assessments 60 3 24 Supplier Responsibility Scorecard average score—Commodity suppliers††† 86% 89% 89% Supplier Responsibility Scorecard average score—Final assembly suppliers††† 83% 82% 85% Rates of conformance of sites audited, 2019 and 2021 (see page 42) * Data in this table for 2019 is specific to production suppliers, except the following included in sustainability audits and other assessments: 64 initial audits of nonproduction suppliers and 17 initial audits of product transportation suppliers. Data in this table for 2020 is specific to production suppliers, except the following included in sustainability audits and other assessments: 13 initial audits of nonproduction 43 2021 HP Sustainable Impact Report www.hp.com/sustainableimpact
 HP Sustainable Impact Report Page 42 Page 44