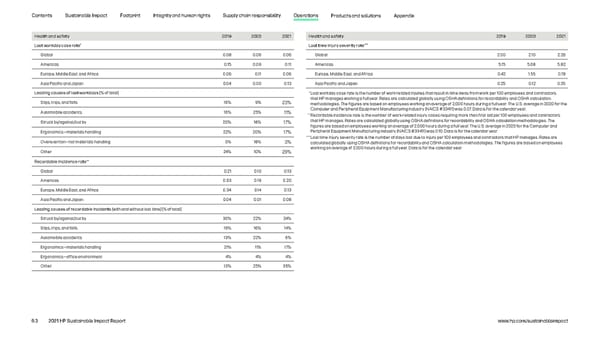
Contents Sustainable Impact Footprint Integrity and human rights Supply chain responsibility Operations Products and solutions Appendix Health and safety 2019 2020 2021 Health and safety 2019 2020 2021 Lost workday case rate* Lost time injury severity rate*** Global 0.08 0.06 0.06 Global 2.00 2.10 2.26 Americas 0.15 0.09 0.11 Americas 5.15 5.08 5.82 Europe, Middle East, and Africa 0.06 0.11 0.06 Europe, Middle East, and Africa 0.42 1.55 0.78 Asia Pacific and Japan 0.04 0.00 0.13 Asia Pacific and Japan 0.25 0.12 0.35 Leading causes of lost workdays [% of total] * Lost workday case rate is the number of work-related injuries that result in time away from work per 100 employees and contractors that HP manages working a full year. Rates are calculated globally using OSHA definitions for recordability and OSHA calculation Slips, trips, and falls 16% 9% 23% methodologies. The figures are based on employees working an average of 2,000 hours during a full year. The U.S. average in 2020 for the Automobile accidents 16% 25% 11% Computer and Peripheral Equipment Manufacturing industry (NAICS #33411) was 0.07. Data is for the calendar year. ** Recordable incidence rate is the number of work-related injury cases requiring more than first aid per 100 employees and contractors Struck by/against/cut by 20% 18% 17% that HP manages. Rates are calculated globally using OSHA definitions for recordability and OSHA calculation methodologies. The figures are based on employees working an average of 2,000 hours during a full year. The U.S. average in 2020 for the Computer and Ergonomics—materials handling 22% 20% 17% Peripheral Equipment Manufacturing industry (NAICS #33411) was 0.10. Data is for the calendar year. *** Lost time injury severity rate is the number of days lost due to injury per 100 employees and contractors that HP manages. Rates are Overexertion—not materials handling 0% 18% 3% calculated globally using OSHA definitions for recordability and OSHA calculation methodologies. The figures are based on employees Other 24% 10% 29% working an average of 2,000 hours during a full year. Data is for the calendar year. Recordable incidence rate** Global 0.21 0.10 0.13 Americas 0.33 0.19 0.20 Europe, Middle East, and Africa 0.34 0.14 0.13 Asia Pacific and Japan 0.04 0.01 0.08 Leading causes of recordable incidents (with and without lost time) [% of total] Struck by/against/cut by 30% 22% 24% Slips, trips, and falls 19% 16% 14% Automobile accidents 13% 22% 6% Ergonomics—materials handling 21% 11% 17% Ergonomics—office environment 4% 4% 4% Other 13% 25% 35% 63 2021 HP Sustainable Impact Report www.hp.com/sustainableimpact
 HP Sustainable Impact Report Page 62 Page 64