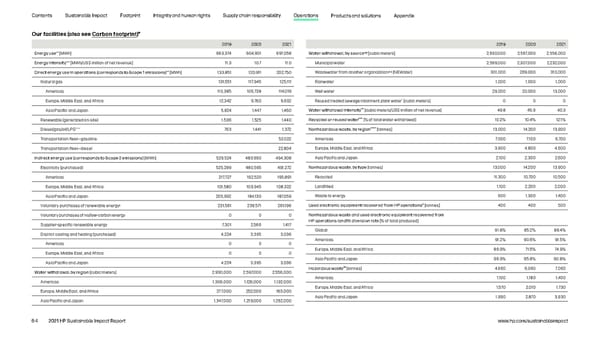
Contents Sustainable Impact Footprint Integrity and human rights Supply chain responsibility Operations Products and solutions Appendix Our facilities (also see Carbon footprint)* 2019 2020 2021 2019 2020 2021 ** Water withdrawal, by source†† Energy use [MWh] 663,374 604,901 697,058 [cubic meters] 2,930,000 2,597,000 2,556,000 *** Municipal water 2,599,000 2,307,000 2,232,000 Energy intensity [MWh/US$ million of net revenue] 11.3 10.7 11.0 ** ††† Direct energy use in operations (corresponds to Scope 1 emissions) [MWh] 133,851 120,911 202,750 Wastewater from another organization (NEWater) 301,000 269,000 310,000 Natural gas 131,551 117,945 125,111 Rainwater 1,000 1,000 1,000 Americas 113,385 106,738 114,019 Well water 29,000 20,000 13,000 ^ [cubic meters] 0 0 0 Europe, Middle East, and Africa 12,342 9,760 9,632 Reused treated sewage treatment plant water ^^ Asia Pacific and Japan 5,824 1,447 1,460 Water withdrawal intensity [cubic meters/US$ million of net revenue] 49.8 45.9 40.3 ^^^ Renewable (generated on-site) 1,536 1,525 1,440 Recycled or reused water [% of total water withdrawal] 10.2% 10.4% 12.1% **** ^^^^ Diesel/gas/oil/LPG 763 1,441 1,372 Nonhazardous waste, by region [tonnes] 13,000 14,200 13,900 Transportation fleet—gasoline 52,022 Americas 7,000 7,100 6,700 Transportation fleet—diesel 22,804 Europe, Middle East, and Africa 3,900 4,800 4,600 Indirect energy use (corresponds to Scope 2 emissions) [MWh] 529,524 483,990 494,308 Asia Pacific and Japan 2,100 2,300 2,600 Electricity (purchased) 525,299 480,595 491,272 Nonhazardous waste, by type [tonnes] 13,000 14,200 13,900 Americas 217,727 192,520 195,891 Recycled 11,300 10,700 10,500 Europe, Middle East, and Africa 101,580 103,945 108,322 Landfilled 1,100 2,200 2,000 Asia Pacific and Japan 205,992 184,130 187,059 Waste to energy 600 1,300 1,400 Voluntary purchases of renewable energy† 231,561 239,571 261,196 Used electronic equipment recovered from HP operations‡ [tonnes] 400 400 500 Voluntary purchases of no/low-carbon energy 0 0 0 Nonhazardous waste and used electronic equipment recovered from HP operations landfill diversion rate [% of total produced] Supplier-specific renewable energy 7,301 2,566 1,417 Global 91.8% 85.2% 86.4% District cooling and heating (purchased) 4,224 3,395 3,036 Americas 91.2% 90.6% 91.5% Americas 0 0 0 Europe, Middle East, and Africa 89.9% 71.5% 74.9% Europe, Middle East, and Africa 0 0 0 Asia Pacific and Japan 96.9% 95.8% 90.8% Asia Pacific and Japan 4,224 3,395 3,036 ‡‡ Hazardous waste [tonnes] 4,660 6,060 7,060 Water withdrawal, by region [cubic meters] 2,930,000 2,597,000 2,556,000 Americas 1,100 1,180 1,400 Americas 1,306,000 1,126,000 1,132,000 Europe, Middle East, and Africa 1,570 2,010 1,730 Europe, Middle East, and Africa 277,000 252,000 163,000 Asia Pacific and Japan 1,990 2,870 3,930 Asia Pacific and Japan 1,347,000 1,219,000 1,262,000 64 2021 HP Sustainable Impact Report www.hp.com/sustainableimpact
 HP Sustainable Impact Report Page 63 Page 65