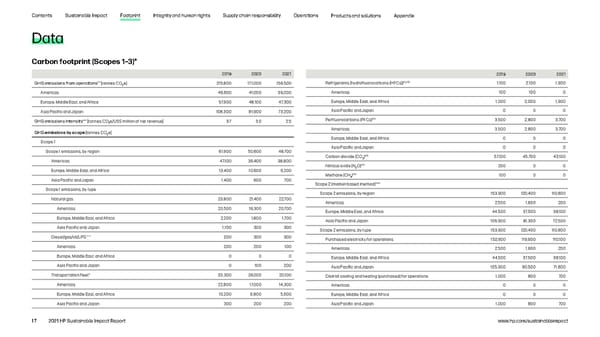
Contents Sustainable Impact Footprint Integrity and human rights Supply chain responsibility Operations Products and solutions Appendix Data Carbon footprint (Scopes 1–3)* 2019 2020 2021 2019 2020 2021 GHG emissions from operations** Refrigerants (hydrofluorocarbons (HFCs))††, ††† 1,100 2,100 1,900 [tonnes CO2e] 215,800 171,000 159,500 Americas 49,600 41,000 39,000 Americas 100 100 0 Europe, Middle East, and Africa 57,900 48,100 47,300 Europe, Middle East, and Africa 1,000 2,000 1,900 Asia Pacific and Japan 108,300 81,900 73,200 Asia Pacific and Japan 0 0 0 *** Perfluorocarbons (PFCs)††† 3,500 2,800 3,700 GHG emissions intensity [tonnes CO e/US$ million of net revenue] 3.7 3.0 2.5 2 GHG emissions by scope [tonnes CO e] Americas 3,500 2,800 3,700 2 Europe, Middle East, and Africa 0 0 0 Scope 1 Asia Pacific and Japan 0 0 0 Scope 1 emissions, by region 61,900 50,600 48,700 Carbon dioxide (CO )††† 57,100 45,700 43,100 Americas 47,100 39,400 38,800 2 Nitrous oxide (N O)††† 200 0 0 Europe, Middle East, and Africa 13,400 10,600 9,200 2 Methane (CH )††† 100 0 0 Asia Pacific and Japan 1,400 600 700 4 Scope 2 (market-based method)†††† Scope 1 emissions, by type Scope 2 emissions, by region 153,900 120,400 110,800 Natural gas 23,800 21,400 22,700 Americas 2,500 1,600 200 Americas 20,500 19,300 20,700 Europe, Middle East, and Africa 44,500 37,500 38,100 Europe, Middle East, and Africa 2,200 1,800 1,700 Asia Pacific and Japan 106,900 81,300 72,500 Asia Pacific and Japan 1,100 300 300 Scope 2 emissions, by type 153,900 120,400 110,800 Diesel/gas/oil/LPG**** 200 300 300 Purchased electricity for operations 152,900 119,600 110,100 Americas 200 200 100 Americas 2,500 1,600 200 Europe, Middle East, and Africa 0 0 0 Europe, Middle East, and Africa 44,500 37,500 38,100 Asia Pacific and Japan 0 100 200 Asia Pacific and Japan 105,900 80,500 71,800 Transportation fleet† 33,300 24,000 20,100 District cooling and heating (purchased) for operations 1,000 800 700 Americas 22,800 17,000 14,300 Americas 0 0 0 Europe, Middle East, and Africa 10,200 6,800 5,600 Europe, Middle East, and Africa 0 0 0 Asia Pacific and Japan 300 200 200 Asia Pacific and Japan 1,000 800 700 17 2021 HP Sustainable Impact Report www.hp.com/sustainableimpact
 HP Sustainable Impact Report Page 16 Page 18