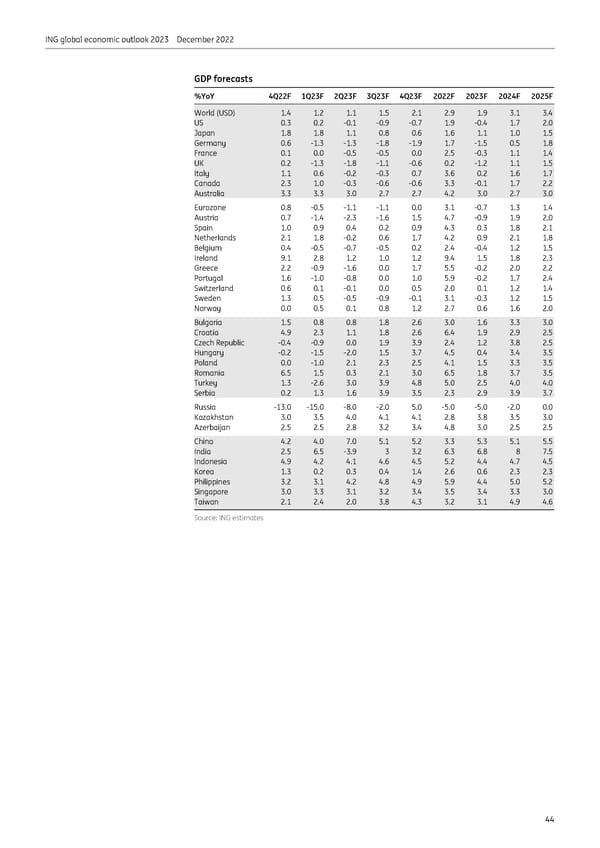
ING global economic outlook 2023 December 2022 GDP forecasts %YoY 4Q22F 1Q23F 2Q23F 3Q23F 4Q23F 2022F 2023F 2024F 2025F World (USD) 1.4 1.2 1.1 1.5 2.1 2.9 1.9 3.1 3.4 US 0.3 0.2 -0.1 -0.9 -0.7 1.9 -0.4 1.7 2.0 Japan 1.8 1.8 1.1 0.8 0.6 1.6 1.1 1.0 1.5 Germany 0.6 -1.3 -1.3 -1.8 -1.9 1.7 -1.5 0.5 1.8 France 0.1 0.0 -0.5 -0.5 0.0 2.5 -0.3 1.1 1.4 UK 0.2 -1.3 -1.8 -1.1 -0.6 0.2 -1.2 1.1 1.5 Italy 1.1 0.6 -0.2 -0.3 0.7 3.6 0.2 1.6 1.7 Canada 2.3 1.0 -0.3 -0.6 -0.6 3.3 -0.1 1.7 2.2 Australia 3.3 3.3 3.0 2.7 2.7 4.2 3.0 2.7 3.0 Eurozone 0.8 -0.5 -1.1 -1.1 0.0 3.1 -0.7 1.3 1.4 Austria 0.7 -1.4 -2.3 -1.6 1.5 4.7 -0.9 1.9 2.0 Spain 1.0 0.9 0.4 0.2 0.9 4.3 0.3 1.8 2.1 Netherlands 2.1 1.8 -0.2 0.6 1.7 4.2 0.9 2.1 1.8 Belgium 0.4 -0.5 -0.7 -0.5 0.2 2.4 -0.4 1.2 1.5 Ireland 9.1 2.8 1.2 1.0 1.2 9.4 1.5 1.8 2.3 Greece 2.2 -0.9 -1.6 0.0 1.7 5.5 -0.2 2.0 2.2 Portugal 1.6 -1.0 -0.8 0.0 1.0 5.9 -0.2 1.7 2.4 Switzerland 0.6 0.1 -0.1 0.0 0.5 2.0 0.1 1.2 1.4 Sweden 1.3 0.5 -0.5 -0.9 -0.1 3.1 -0.3 1.2 1.5 Norway 0.0 0.5 0.1 0.8 1.2 2.7 0.6 1.6 2.0 Bulgaria 1.5 0.8 0.8 1.8 2.6 3.0 1.6 3.3 3.0 Croatia 4.9 2.3 1.1 1.8 2.6 6.4 1.9 2.9 2.5 Czech Republic -0.4 -0.9 0.0 1.9 3.9 2.4 1.2 3.8 2.5 Hungary -0.2 -1.5 -2.0 1.5 3.7 4.5 0.4 3.4 3.5 Poland 0.0 -1.0 2.1 2.3 2.5 4.1 1.5 3.3 3.5 Romania 6.5 1.5 0.3 2.1 3.0 6.5 1.8 3.7 3.5 Turkey 1.3 -2.6 3.0 3.9 4.8 5.0 2.5 4.0 4.0 Serbia 0.2 1.3 1.6 3.9 3.5 2.3 2.9 3.9 3.7 Russia -13.0 -15.0 -8.0 -2.0 5.0 -5.0 -5.0 -2.0 0.0 Kazakhstan 3.0 3.5 4.0 4.1 4.1 2.8 3.8 3.5 3.0 Azerbaijan 2.5 2.5 2.8 3.2 3.4 4.8 3.0 2.5 2.5 China 4.2 4.0 7.0 5.1 5.2 3.3 5.3 5.1 5.5 India 2.5 6.5 -3.9 3 3.2 6.3 6.8 8 7.5 Indonesia 4.9 4.2 4.1 4.6 4.5 5.2 4.4 4.7 4.5 Korea 1.3 0.2 0.3 0.4 1.4 2.6 0.6 2.3 2.3 Philippines 3.2 3.1 4.2 4.8 4.9 5.9 4.4 5.0 5.2 Singapore 3.0 3.3 3.1 3.2 3.4 3.5 3.4 3.3 3.0 Taiwan 2.1 2.4 2.0 3.8 4.3 3.2 3.1 4.9 4.6 Source: ING estimates 44
 ING Global Economic Outlook 2023 Page 43 Page 45