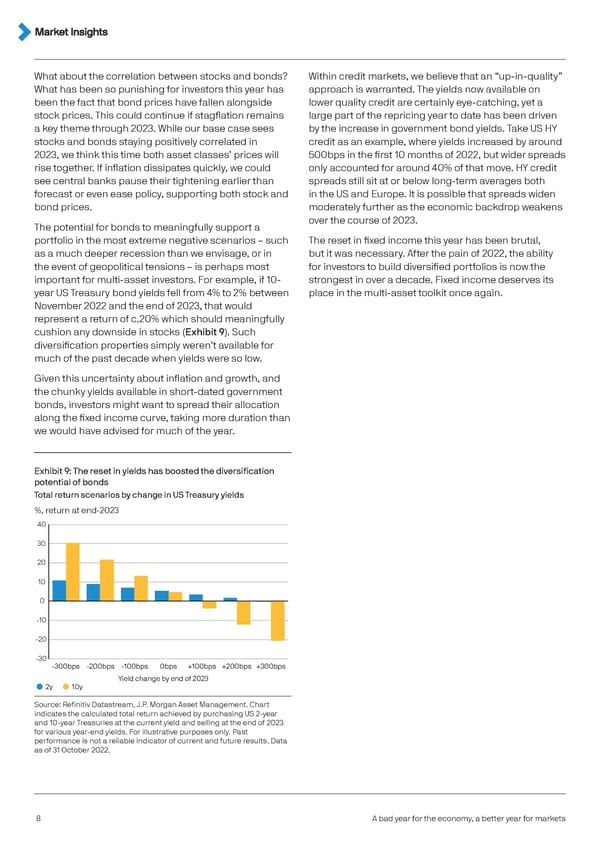
What about the correlation between stocks and bonds? Within credit markets, we believe that an “up-in-quality” What has been so punishing for investors this year has approach is warranted. The yields now available on been the fact that bond prices have fallen alongside lower quality credit are certainly eye-catching, yet a stock prices. This could continue if stagflation remains large part of the repricing year to date has been driven a key theme through 2023. While our base case sees by the increase in government bond yields. Take US HY stocks and bonds staying positively correlated in credit as an example, where yields increased by around 2023, we think this time both asset classes’ prices will 500bps in the first 10 months of 2022, but wider spreads rise together. If inflation dissipates quickly, we could only accounted for around 40% of that move. HY credit see central banks pause their tightening earlier than spreads still sit at or below long-term averages both forecast or even ease policy, supporting both stock and in the US and Europe. It is possible that spreads widen bond prices. moderately further as the economic backdrop weakens The potential for bonds to meaningfully support a over the course of 2023. portfolio in the most extreme negative scenarios – such The reset in fixed income this year has been brutal, as a much deeper recession than we envisage, or in but it was necessary. After the pain of 2022, the ability the event of geopolitical tensions – is perhaps most for investors to build diversified portfolios is now the important for multi-asset investors. For example, if 10- strongest in over a decade. Fixed income deserves its year US Treasury bond yields fell from 4% to 2% between place in the multi-asset toolkit once again. November 2022 and the end of 2023, that would represent a return of c.20% which should meaningfully cushion any downside in stocks (Exhibit 9). Such diversification properties simply weren’t available for much of the past decade when yields were so low. Given this uncertainty about inflation and growth, and the chunky yields available in short-dated government bonds, investors might want to spread their allocation along the fixed income curve, taking more duration than we would have advised for much of the year. Exhibit 9: The reset in yields has boosted the diversification potential of bonds Total return scenarios by change in US Treasury yields %, return at end-2023 40 30 20 10 0 -10 -20 -30 -300bps -200bps -100bps 0bps +100bps +200bps +300bps Yield change by end of 2023 2y 10y Source: Refinitiv Datastream, J.P. Morgan Asset Management. Chart indicates the calculated total return achieved by purchasing US 2-year and 10-year Treasuries at the current yield and selling at the end of 2023 for various year-end yields. For illustrative purposes only. Past performance is not a reliable indicator of current and future results. Data as of 31 October 2022. 8 A bad year for the economy, a better year for markets
 J.P. Morgan Investment Outlook 2023 Page 7 Page 9