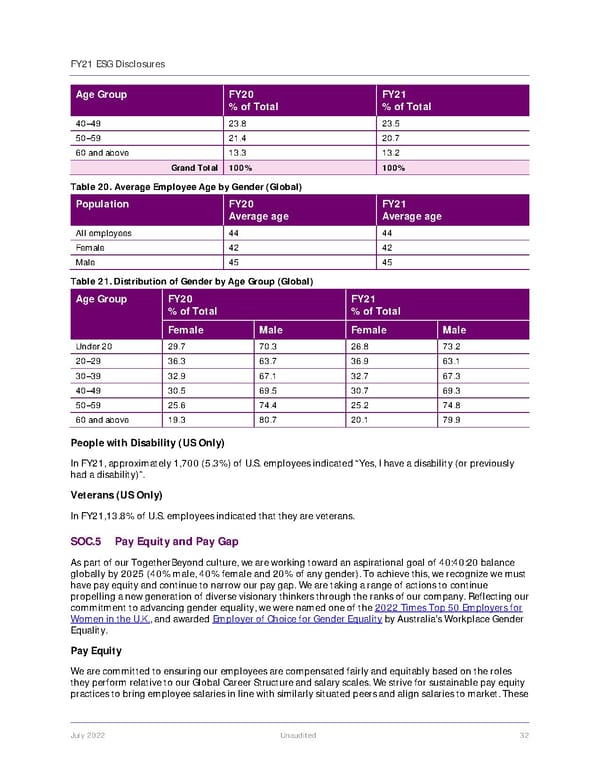
FY21 ESG Disclosures July 2022 Unaudited 32 Age Group FY20 % of Total FY21 % of Total 40–49 23.8 23.5 50–59 21.4 20.7 60 and above 13.3 13.2 Grand Total 100% 100% Table 20. Average Employee Age by Gender (Global) Population FY20 Average age FY21 Average age All employees 44 44 Female 42 42 Male 45 45 Table 21. Distribution of Gender by Age Group (Global) Age Group FY20 % of Total FY21 % of Total Female Male Female Male Under 20 29.7 70.3 26.8 73.2 20–29 36.3 63.7 36.9 63.1 30–39 32.9 67.1 32.7 67.3 40–49 30.5 69.5 30.7 69.3 50–59 25.6 74.4 25.2 74.8 60 and above 19.3 80.7 20.1 79.9 People with Disability (US Only) In FY21, approximately 1,700 (5.3%) of U.S. employees indicated “Yes, I have a disability (or previously had a disability)”. Veterans (US Only) In FY21,13.8% of U.S. employees indicated that they are veterans. SOC.5 Pay Equity and Pay Gap As part of our TogetherBeyond culture, we are working toward an aspirational goal of 40:40:20 balance globally by 2025 (40% male, 40% female and 20% of any gender). To achieve this, we recognize we must have pay equity and continue to narrow our pay gap. We are taking a range of actions to continue propelling a new generation of diverse visionary thinkers through the ranks of our company. Reflecting our commitment to advancing gender equality, we were named one of the 2022 Times Top 50 Employers for Women in the U.K. , and awarded Employer of Choice for Gender Equality by Australia’s Workplace Gender Equality. Pay Equity We are committed to ensuring our employees are compensated fairly and equitably based on the roles they perform relative to our Global Career Structure and salary scales. We strive for sustainable pay equity practices to bring employee salaries in line with similarly situated peers and align salaries to market. These
 Jacobs Engineering Group ESG Disclosures Page 32 Page 34