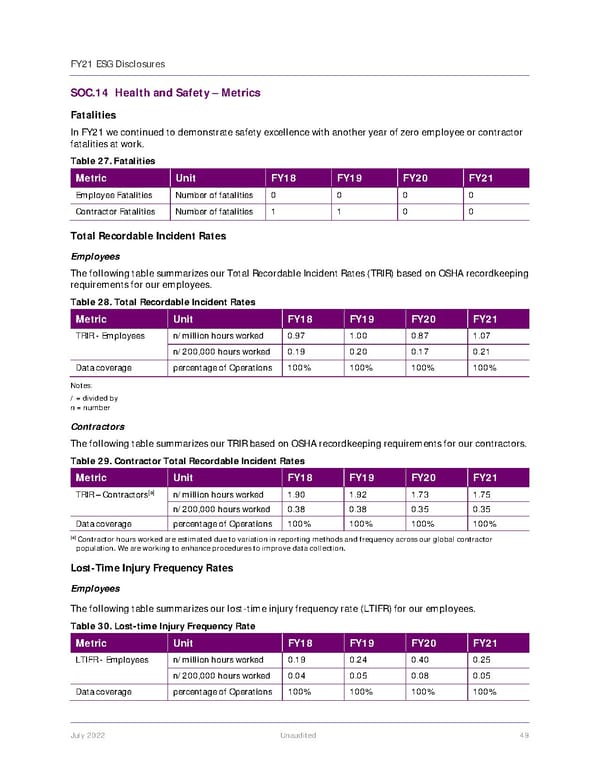
FY21 ESG Disclosures July 2022 Unaudited 49 SOC.14 Health and Safety – Metrics Fatalities In FY21 we continued to demonstrate safety excellence with another year of zero employee or contractor fatalities at work. Table 27. Fatalities Metric Unit FY18 FY19 FY20 FY21 Employee Fatalities Number of fatalities 0 0 0 0 Contractor Fatalities Number of fatalities 1 1 0 0 Total Recordable Incident Rates Employees The following table summarizes our Total Recordable Incident Rates (TRIR) based on OSHA recordkeeping requirements for our employees. Table 28. Total Recordable Incident Rates Metric Unit FY18 FY19 FY20 FY21 TRIR - Employees n/million hours worked 0.97 1.00 0.87 1.07 n/200,000 hours worked 0.19 0.20 0.17 0.21 Data coverage percentage of Operations 100% 100% 100% 100% Notes: / = divided by n = number Contractors The following table summarizes our TRIR based on OSHA recordkeeping requirements for our contractors. Table 29. Contractor Total Recordable Incident Rates Metric Unit FY18 FY19 FY20 FY21 TRIR – Contractors [a] n/million hours worked 1.90 1.92 1.73 1.75 n/200,000 hours worked 0.38 0.38 0.35 0.35 Data coverage percentage of Operations 100% 100% 100% 100% [a] Contractor hours worked are estimated due to variation in reporting methods and frequency across our global contractor population. We are working to enhance procedures to improve data collection. Lost-Time Injury Frequency Rates Employees The following table summarizes our lost-time injury frequency rate (LTIFR) for our employees. Table 30. Lost-time Injury Frequency Rate Metric Unit FY18 FY19 FY20 FY21 LTIFR - Employees n/million hours worked 0.19 0.24 0.40 0.25 n/200,000 hours worked 0.04 0.05 0.08 0.05 Data coverage percentage of Operations 100% 100% 100% 100%
 Jacobs Engineering Group ESG Disclosures Page 49 Page 51