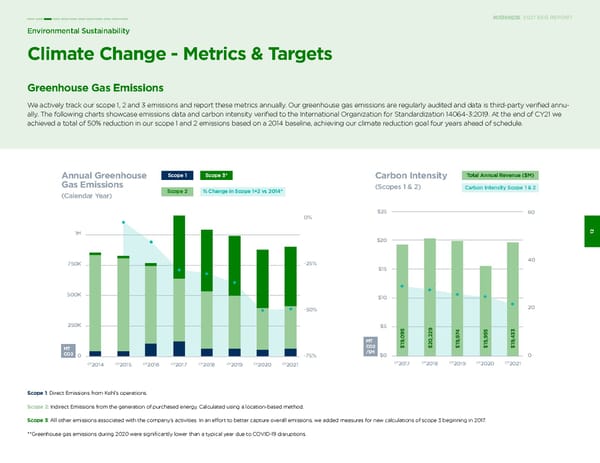
1M 750K 500K 250K 0 MT CO2 0% -25% -50% -75% CY 2014 CY 2015 CY 2016 CY 2017 CY 2018 CY 2019 CY 2020 CY 2021 Greenhouse Gas Emissions We actively track our scope 1, 2 and 3 emissions and report these metrics annually. Our greenhouse gas emissions are regularly audited and data is third-party verified annu- ally. The following charts showcase emissions data and carbon intensity verified to the International Organization for Standardization 14064-3:2019. At the end of CY21 we achieved a total of 50% reduction in our scope 1 and 2 emissions based on a 2014 baseline, achieving our climate reduction goal four years ahead of schedule. Environmental Sustainability 12 2021 ESG REPORT Scope 1 : Direct Emissions from Kohl’s operations. Scope 2 : Indirect Emissions from the generation of purchased energy. Calculated using a location-based method. Scope 3 : All other emissions associated with the company’s activities. In an effort to better capture overall emissions, we added measures for new calculations of scope 3 beginning in 2017. **Greenhouse gas emissions during 2020 were significantly lower than a typical year due to COVID-19 disruptions. Climate Change - Metrics & Targets Annual Greenhouse Gas Emissions (Calendar Year) Scope 1 Scope 2 Scope 3* % Change in Scope 1+2 vs 2014* $25 $20 $15 $10 $5 $0 60 40 20 0 MT CO2 /$M $19,095 $19,974 $15,955 $19,433 $20,229 CY 2017 CY 2018 CY 2019 CY 2020 CY 2021 Total Annual Revenue ($M) Carbon Intensity Scope 1 & 2 Carbon Intensity (Scopes 1 & 2)
 Kohl's 2021 ESG Report Page 11 Page 13