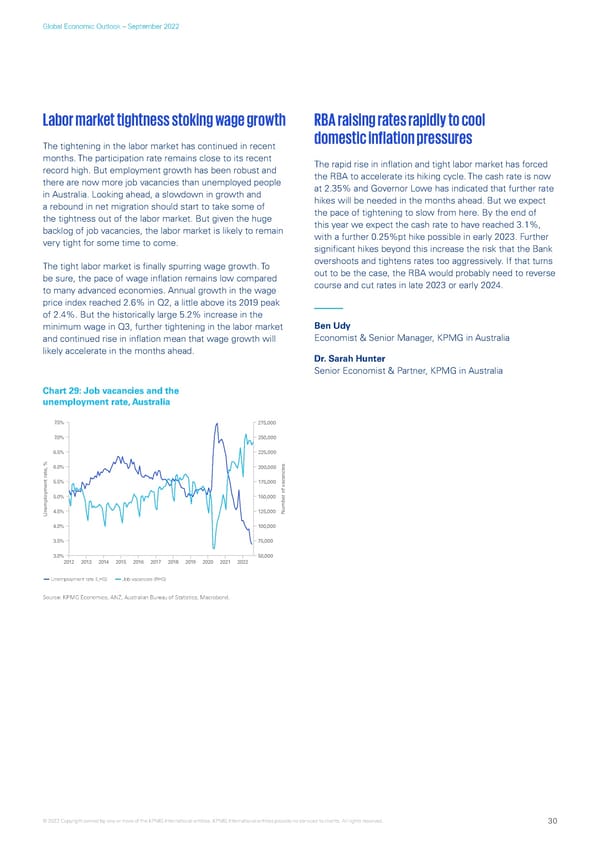
Global Economic Outlook – September 2022 Labor market tightness stoking wage growth RBA raising rates rapidly to cool The tightening in the labor market has continued in recent domestic inflation pressures months. The participation rate remains close to its recent The rapid rise in inflation and tight labor market has forced record high. But employment growth has been robust and the RBA to accelerate its hiking cycle. The cash rate is now there are now more job vacancies than unemployed people at 2.35% and Governor Lowe has indicated that further rate in Australia. Looking ahead, a slowdown in growth and hikes will be needed in the months ahead. But we expect a rebound in net migration should start to take some of the pace of tightening to slow from here. By the end of the tightness out of the labor market. But given the huge this year we expect the cash rate to have reached 3.1%, backlog of job vacancies, the labor market is likely to remain with a further 0.25%pt hike possible in early 2023. Further very tight for some time to come. significant hikes beyond this increase the risk that the Bank The tight labor market is finally spurring wage growth. To overshoots and tightens rates too aggressively. If that turns be sure, the pace of wage inflation remains low compared out to be the case, the RBA would probably need to reverse to many advanced economies. Annual growth in the wage course and cut rates in late 2023 or early 2024. price index reached 2.6% in Q2, a little above its 2019 peak of 2.4%. But the historically large 5.2% increase in the minimum wage in Q3, further tightening in the labor market Ben Udy and continued rise in inflation mean that wage growth will Economist & Senior Manager, KPMG in Australia likely accelerate in the months ahead. Dr. Sarah Hunter Senior Economist & Partner, KPMG in Australia Chart 29: Job vacancies and the unemployment rate, Australia AU3 unemployment 7.5% 275,000 7.0% 250,000 6.5% 225,000 6.0% 200,000 5.5% 175,000 5.0% 150,000 Unemployment rate, %4.5% 125,000 Number of vacancies 4.0% 100,000 3.5% 75,000 3.0% 50,000 2012 2013 2014 2015 2016 2017 2018 2019 2020 2021 2022 Unemployment rate (LHS) Job vacancies (RHS) Source: KPMG Economics, ANZ, Australian Bureau of Statistics, Macrobond. © 2022 Copyright owned by one or more of the KPMG International entities. KPMG International entities provide no services to clients. All rights reserved. 30
 KPMG Global Economic Outlook - H2 2022 report Page 29 Page 31