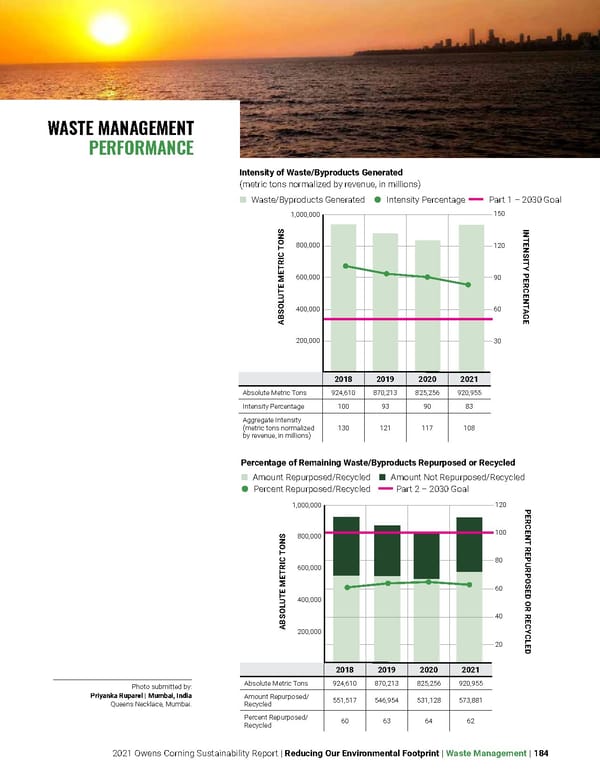
2021 Owens Corning Sustainability Report | Reducing Our Environmental Footprint | Waste Management | 184 WASTE MANAGEMENT PERFORMANCE Photo submitted by: Priyanka Ruparel | Mumbai, India Queens Necklace, Mumbai. ABSOLUTE METRIC TONS PERCENT REPURPOSED OR RECYCLED 2018 2019 2020 2021 Absolute Metric Tons 924,610 870,213 825,256 920,955 Amount Repurposed/ Recycled 551,517 546,954 531,128 573,881 Percent Repurposed/ Recycled 60 63 64 62 1,000,000 800,000 600,000 400,000 200,000 120 100 80 60 40 20 Percentage of Remaining Waste/Byproducts Repurposed or Recycled ■ Amount Repurposed/Recycled ■ Amount Not Repurposed/Recycled Percent Repurposed/Recycled Part 2 – 2030 Goal Intensity of Waste/Byproducts Generated (metric tons normalized by revenue, in millions) ABSOLUTE METRIC TONS INTENSITY PERCENTAGE 2018 2019 2020 2021 Absolute Metric Tons 924,610 870,213 825,256 920,955 Intensity Percentage 100 93 90 83 Aggregate Intensity (metric tons normalized by revenue, in millions) 130 121 117 108 1,000,000 800,000 600,000 400,000 200,000 150 120 90 60 30 ■ Waste/Byproducts Generated Intensity Percentage Part 1 – 2030 Goal
 Owens Corning Sustainability Report Page 183 Page 185