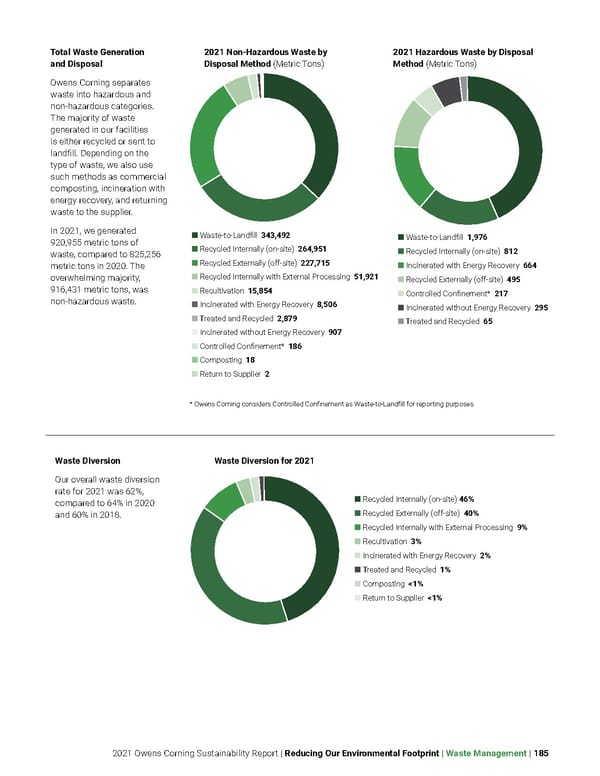
2021 Owens Corning Sustainability Report | Reducing Our Environmental Footprint | Waste Management | 185 Total Waste Generation and Disposal Owens Corning separates waste into hazardous and non-hazardous categories. The majority of waste generated in our facilities is either recycled or sent to landfill. Depending on the type of waste, we also use such methods as commercial composting, incineration with energy recovery, and returning waste to the supplier. In 2021, we generated 920,955 metric tons of waste, compared to 825,256 metric tons in 2020. The overwhelming majority, 916,431 metric tons, was non-hazardous waste. Waste Diversion Our overall waste diversion rate for 2021 was 62%, compared to 64% in 2020 and 60% in 2018. Waste-to-Landfill 343,492 Recycled Internally (on-site) 264,951 Recycled Externally (off-site) 227,715 Recycled Internally with External Processing 51,921 Recultivation 15,854 Incinerated with Energy Recovery 8,506 Treated and Recycled 2,879 Incinerated without Energy Recovery 907 Controlled Confinement* 186 Composting 18 Return to Supplier 2 2021 Non-Hazardous Waste by Disposal Method (Metric Tons) Waste-to-Landfill 1,976 Recycled Internally (on-site) 812 Incinerated with Energy Recovery 664 Recycled Externally (off-site) 495 Controlled Confinement* 217 Incinerated without Energy Recovery 295 Treated and Recycled 65 2021 Hazardous Waste by Disposal Method (Metric Tons) Recycled Internally (on-site) 46% Recycled Externally (off-site) 40% Recycled Internally with External Processing 9% Recultivation 3% Incinerated with Energy Recovery 2% Treated and Recycled 1% Composting <1% Return to Supplier <1% Waste Diversion for 2021 * Owens Corning considers Controlled Confinement as Waste-to-Landfill for reporting purposes.
 Owens Corning Sustainability Report Page 184 Page 186