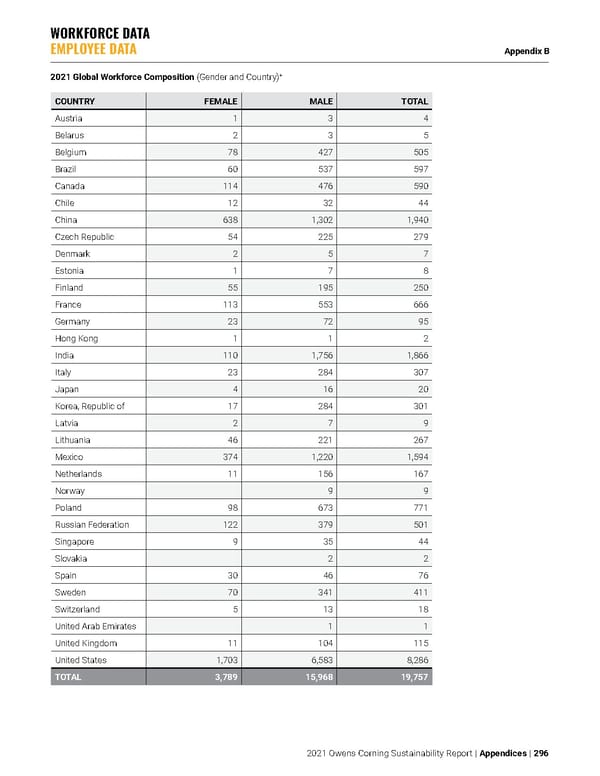
2021 Global Workforce Composition (Gender and Country) + COUNTRY FEMALE MALE TOTAL Austria 1 3 4 Belarus 2 3 5 Belgium 78 427 505 Brazil 60 537 597 Canada 114 476 590 Chile 12 32 44 China 638 1,302 1,940 Czech Republic 54 225 279 Denmark 2 5 7 Estonia 1 7 8 Finland 55 195 250 France 113 553 666 Germany 23 72 95 Hong Kong 1 1 2 India 110 1,756 1,866 Italy 23 284 307 Japan 4 16 20 Korea, Republic of 17 284 301 Latvia 2 7 9 Lithuania 46 221 267 Mexico 374 1,220 1,594 Netherlands 11 156 167 Norway 9 9 Poland 98 673 771 Russian Federation 122 379 501 Singapore 9 35 44 Slovakia 2 2 Spain 30 46 76 Sweden 70 341 411 Switzerland 5 13 18 United Arab Emirates 1 1 United Kingdom 11 104 115 United States 1,703 6,583 8,286 TOTAL 3,789 15,968 19,757 WORKFORCE DATA EMPLOYEE DATA Appendix B 2021 Owens Corning Sustainability Report | Appendices | 296
 Owens Corning Sustainability Report Page 295 Page 297