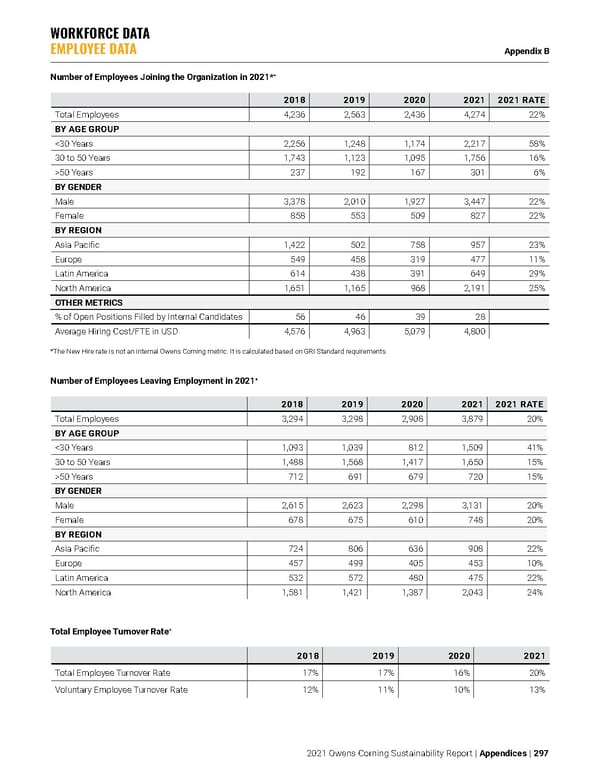
WORKFORCE DATA EMPLOYEE DATA Appendix B 2021 Owens Corning Sustainability Report | Appendices | 297 Number of Employees Joining the Organization in 2021* + Number of Employees Leaving Employment in 2021 + 2018 2019 2020 2021 2021 RATE Total Employees 4,236 2,563 2,436 4,274 22% BY AGE GROUP <30 Years 2,256 1,248 1,174 2,217 58% 30 to 50 Years 1,743 1,123 1,095 1,756 16% >50 Years 237 192 167 301 6% BY GENDER Male 3,378 2,010 1,927 3,447 22% Female 858 553 509 827 22% BY REGION Asia Pacific 1,422 502 758 957 23% Europe 549 458 319 477 11% Latin America 614 438 391 649 29% North America 1,651 1,165 968 2,191 25% OTHER METRICS % of Open Positions Filled by Internal Candidates 56 46 39 28 Average Hiring Cost/FTE in USD 4,576 4,963 5,079 4,800 Total Employee Turnover Rate + 2018 2019 2020 2021 Total Employee Turnover Rate 17% 17% 16% 20% Voluntary Employee Turnover Rate 12% 11% 10% 13% 2018 2019 2020 2021 2021 RATE Total Employees 3,294 3,298 2,908 3,879 20% BY AGE GROUP <30 Years 1,093 1,039 812 1,509 41% 30 to 50 Years 1,488 1,568 1,417 1,650 15% >50 Years 712 691 679 720 15% BY GENDER Male 2,615 2,623 2,298 3,131 20% Female 678 675 610 748 20% BY REGION Asia Pacific 724 806 636 908 22% Europe 457 499 405 453 10% Latin America 532 572 480 475 22% North America 1,581 1,421 1,387 2,043 24% *The New Hire rate is not an internal Owens Corning metric. It is calculated based on GRI Standard requirements.
 Owens Corning Sustainability Report Page 296 Page 298