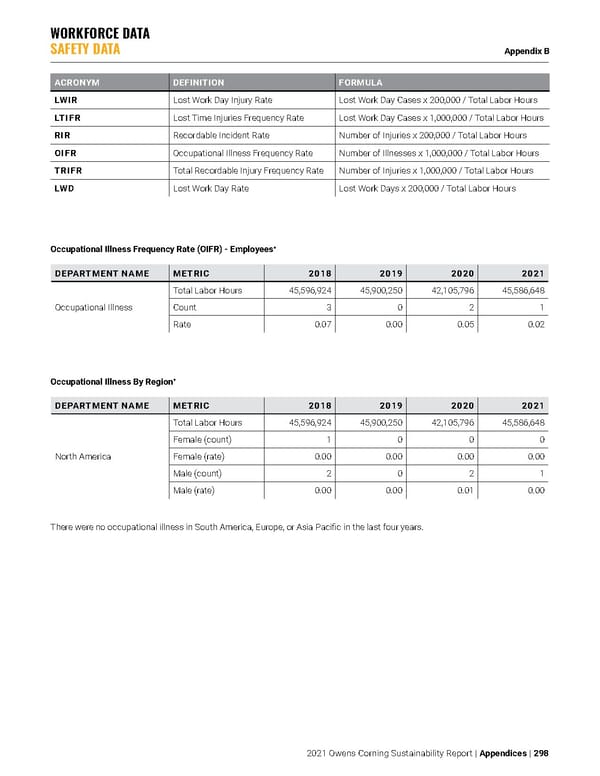
Occupational Illness Frequency Rate (OIFR) - Employees + DEPARTMENT NAME METRIC 2018 2019 2020 2021 Occupational Illness Total Labor Hours 45,596,924 45,900,250 42,105,796 45,586,648 Count 3 0 2 1 Rate 0.07 0.00 0.05 0.02 Occupational Illness By Region + DEPARTMENT NAME METRIC 2018 2019 2020 2021 North America Total Labor Hours 45,596,924 45,900,250 42,105,796 45,586,648 Female (count) 1 0 0 0 Female (rate) 0.00 0.00 0.00 0.00 Male (count) 2 0 2 1 Male (rate) 0.00 0.00 0.01 0.00 There were no occupational illness in South America, Europe, or Asia Pacific in the last four years. WORKFORCE DATA SAFETY DATA Appendix B 2021 Owens Corning Sustainability Report | Appendices | 298 ACRONYM DEFINITION FORMULA LWIR Lost Work Day Injury Rate Lost Work Day Cases x 200,000 / Total Labor Hours LTIFR Lost Time Injuries Frequency Rate Lost Work Day Cases x 1,000,000 / Total Labor Hours RIR Recordable Incident Rate Number of Injuries x 200,000 / Total Labor Hours OIFR Occupational Illness Frequency Rate Number of Illnesses x 1,000,000 / Total Labor Hours TRIFR Total Recordable Injury Frequency Rate Number of Injuries x 1,000,000 / Total Labor Hours LWD Lost Work Day Rate Lost Work Days x 200,000 / Total Labor Hours
 Owens Corning Sustainability Report Page 297 Page 299