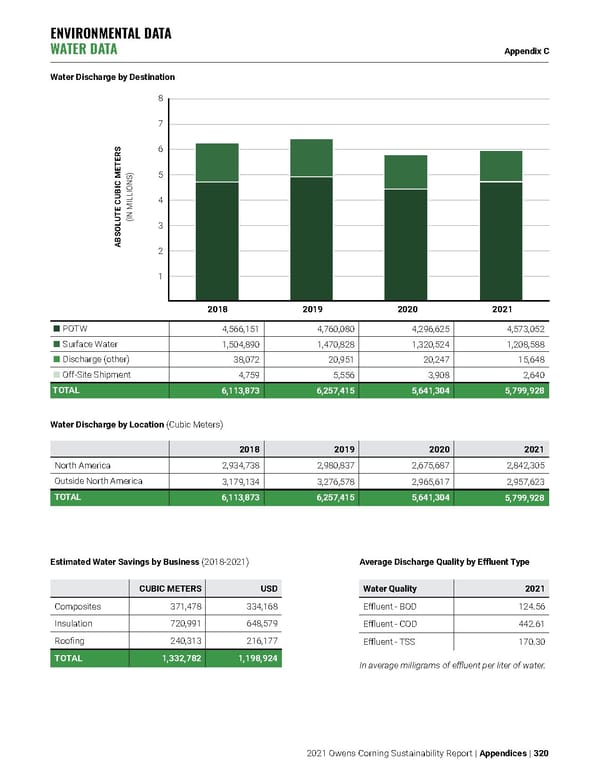
Water Discharge by Destination 8 7 6 5 4 3 2 1 ABSOLUTE CUBIC METERS (IN MILLIONS) Water Discharge by Location (Cubic Meters) Estimated Water Savings by Business (2018-2021) 2018 2019 2020 2021 North America 2,934,738 2,980,837 2,675,687 2,842,305 Outside North America 3,179,134 3,276,578 2,965,617 2,957,623 TOTAL 6,113,873 6,257,415 5,641,304 5,799,928 CUBIC METERS USD Composites 371,478 334,168 Insulation 720,991 648,579 Roofing 240,313 216,177 TOTAL 1,332,782 1,198,924 Water Quality 2021 Effluent - BOD 124.56 Effluent - COD 442.61 Effluent - TSS 170.30 In average milligrams of effluent per liter of water. ENVIRONMENTAL DATA WATER DATA Appendix C 2021 Owens Corning Sustainability Report | Appendices | 320 Average Discharge Quality by Effluent Type POTW 4,566,151 4,760,080 4,296,625 4,573,052 Surface Water 1,504,890 1,470,828 1,320,524 1,208,588 Discharge (other) 38,072 20,951 20,247 15,648 Off-Site Shipment 4,759 5,556 3,908 2,640 TOTAL 6,113,873 6,257,415 5,641,304 5,799,928 2018 2019 2020 2021
 Owens Corning Sustainability Report Page 319 Page 321