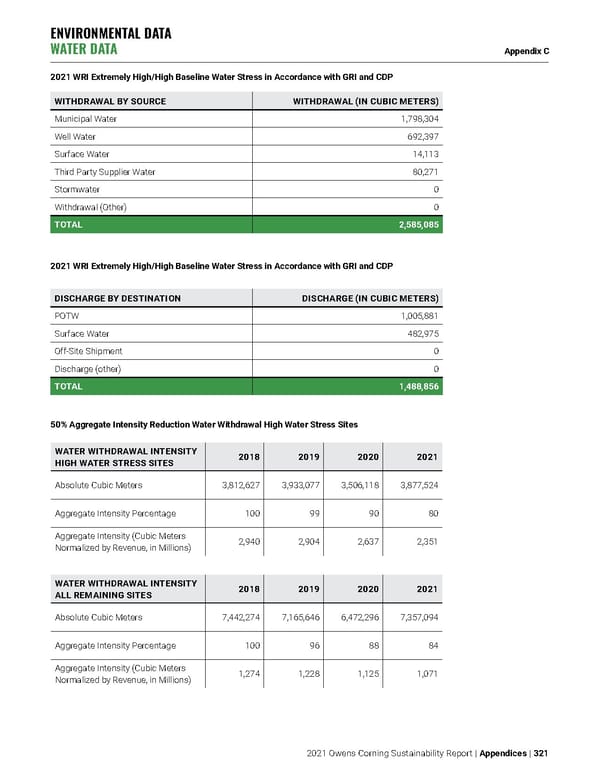
WITHDRAWAL BY SOURCE WITHDRAWAL (IN CUBIC METERS) Municipal Water 1,798,304 Well Water 692,397 Surface Water 14,113 Third Party Supplier Water 80,271 Stormwater 0 Withdrawal (Other) 0 TOTAL 2,585,085 DISCHARGE BY DESTINATION DISCHARGE (IN CUBIC METERS) POTW 1,005,881 Surface Water 482,975 Off-Site Shipment 0 Discharge (other) 0 TOTAL 1,488,856 50% Aggregate Intensity Reduction Water Withdrawal High Water Stress Sites WATER WITHDRAWAL INTENSITY HIGH WATER STRESS SITES 2018 2019 2020 2021 Absolute Cubic Meters 3,812,627 3,933,077 3,506,118 3,877,524 Aggregate Intensity Percentage 100 99 90 80 Aggregate Intensity (Cubic Meters Normalized by Revenue, in Millions) 2,940 2,904 2,637 2,351 WATER WITHDRAWAL INTENSITY ALL REMAINING SITES 2018 2019 2020 2021 Absolute Cubic Meters 7,442,274 7,165,646 6,472,296 7,357,094 Aggregate Intensity Percentage 100 96 88 84 Aggregate Intensity (Cubic Meters Normalized by Revenue, in Millions) 1,274 1,228 1,125 1,071 2021 WRI Extremely High/High Baseline Water Stress in Accordance with GRI and CDP 2021 WRI Extremely High/High Baseline Water Stress in Accordance with GRI and CDP ENVIRONMENTAL DATA WATER DATA Appendix C 2021 Owens Corning Sustainability Report | Appendices | 321
 Owens Corning Sustainability Report Page 320 Page 322