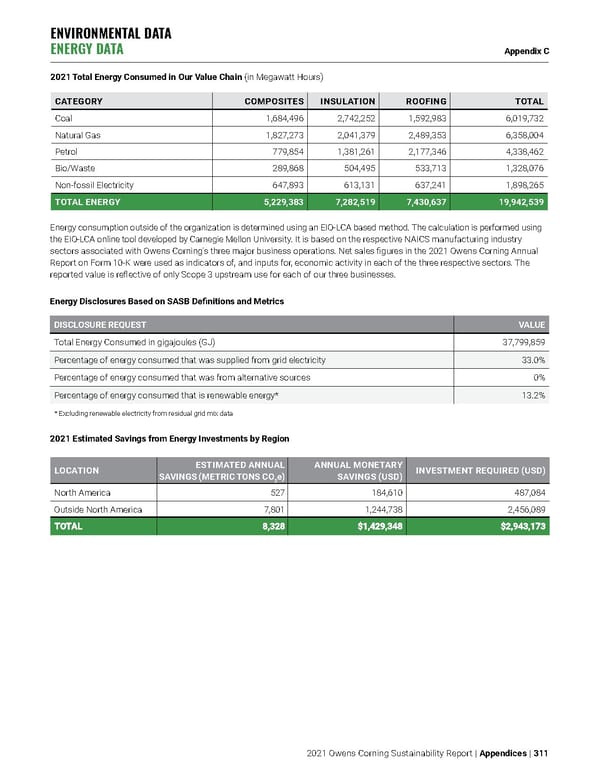
ENVIRONMENTAL DATA ENERGY DATA Appendix C 2021 Owens Corning Sustainability Report | Appendices | 311 2021 Total Energy Consumed in Our Value Chain (in Megawatt Hours) Energy consumption outside of the organization is determined using an EIO-LCA based method. The calculation is performed using the EIO-LCA online tool developed by Carnegie Mellon University. It is based on the respective NAICS manufacturing industry sectors associated with Owens Corning’s three major business operations. Net sales figures in the 2021 Owens Corning Annual Report on Form 10-K were used as indicators of, and inputs for, economic activity in each of the three respective sectors. The reported value is reflective of only Scope 3 upstream use for each of our three businesses. Energy Disclosures Based on SASB Definitions and Metrics 2021 Estimated Savings from Energy Investments by Region LOCATION ESTIMATED ANNUAL SAVINGS (METRIC TONS CO 2 e ) ANNUAL MONETARY SAVINGS (USD) INVESTMENT REQUIRED (USD) North America 527 184,610 487,084 Outside North America 7,801 1,244,738 2,456,089 TOTAL TOTAL 8,328 8,328 $1,429,348 $1,429,348 $2,943,173 $2,943,173 CATEGORY COMPOSITES INSULATION ROOFING TOTAL Coal 1,684,496 2,742,252 1,592,983 6,019,732 Natural Gas 1,827,273 2,041,379 2,489,353 6,358,004 Petrol 779,854 1,381,261 2,177,346 4,338,462 Bio/Waste 289,868 504,495 533,713 1,328,076 Non-fossil Electricity 647,893 613,131 637,241 1,898,265 TOTAL ENERGY 5,229,383 7,282,519 7,430,637 19,942,539 DISCLOSURE REQUEST VALUE Total Energy Consumed in gigajoules (GJ) 37,799,859 Percentage of energy consumed that was supplied from grid electricity 33.0% Percentage of energy consumed that was from alternative sources 0% Percentage of energy consumed that is renewable energy* 13.2% * Excluding renewable electricity from residual grid mix data
 Owens Corning Sustainability Report Page 310 Page 312