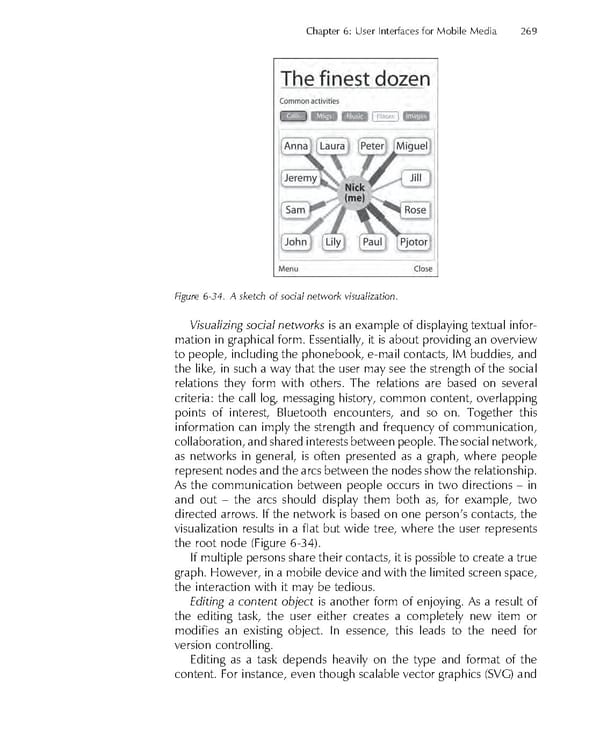
Chapter 6: User Interfaces for Mobile Media 269 Figure 6-34. A sketch of social network visualization. Visualizing social networks is an example of displaying textual infor- mation in graphical form. Essentially, it is about providing an overview to people, including the phonebook, e-mail contacts, IM buddies, and the like, in such a way that the user may see the strength of the social relations they form with others. The relations are based on several criteria: the call log, messaging history, common content, overlapping points of interest, Bluetooth encounters, and so on. Together this information can imply the strength and frequency of communication, collaboration, and shared interests between people. The social network, as networks in general, is often presented as a graph, where people represent nodes and the arcs between the nodes show the relationship. As the communication between people occurs in two directions – in and out – the arcs should display them both as, for example, two directed arrows. If the network is based on one person’s contacts, the visualization results in a fl at but wide tree, where the user represents the root node (Figure 6-34). If multiple persons share their contacts, it is possible to create a true graph. However, in a mobile device and with the limited screen space, the interaction with it may be tedious. Editing a content object is another form of enjoying. As a result of the editing task, the user either creates a completely new item or modifi es an existing object. In essence, this leads to the need for version controlling. Editing as a task depends heavily on the type and format of the content. For instance, even though scalable vector graphics (SVG) and
 Personal Content Experience Page 292 Page 294