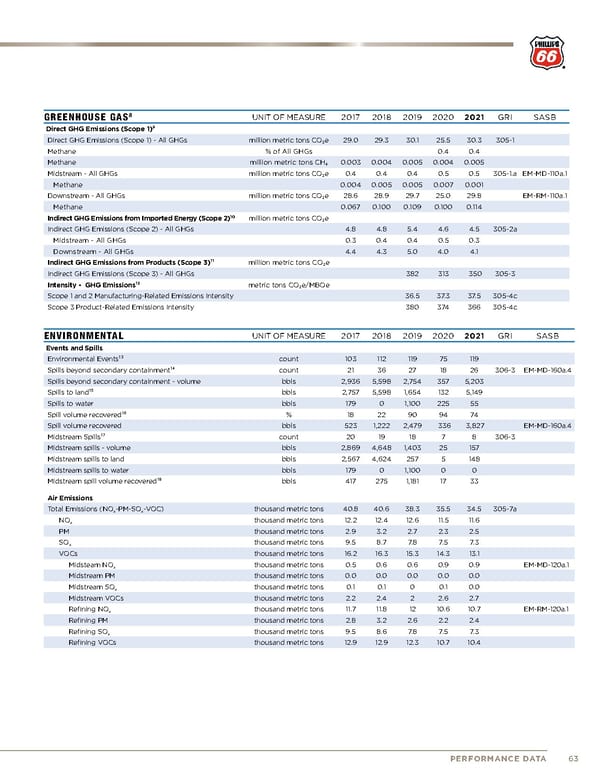
GREENHOUSE GAS 8 UNIT OF MEASURE 2017 2018 2019 2020 2021 GRI SASB Direct GHG Emissions (Scope 1)⁹ Direct GHG Emissions (Scope 1) - All GHGs million metric tons CO₂e 29.0 29.3 30.1 25.5 30.3 305-1 Methane % of All GHGs 0.4 0.4 Methane million metric tons CH₄ 0.003 0.004 0.005 0.004 0.005 Midstream - All GHGs million metric tons CO₂e 0.4 0.4 0.4 0.5 0.5 305-1.a EM-MD-110a.1 Methane 0.004 0.005 0.005 0.007 0.001 Downstream - All GHGs million metric tons CO₂e 28.6 28.9 29.7 25.0 29.8 EM-RM-110a.1 Methane 0.067 0.100 0.109 0.100 0.114 Indirect GHG Emissions from Imported Energy (Scope 2) 10 million metric tons CO₂e Indirect GHG Emissions (Scope 2) - All GHGs 4.8 4.8 5.4 4.6 4.5 305-2a Midstream - All GHGs 0.3 0.4 0.4 0.5 0.3 Downstream - All GHGs 4.4 4.3 5.0 4.0 4.1 Indirect GHG Emissions from Products (Scope 3)¹¹ million metric tons CO₂e Indirect GHG Emissions (Scope 3) - All GHGs 382 313 350 305-3 Intensity - GHG Emissions¹² metric tons CO₂e/MBOe Scope 1 and 2 Manufacturing-Related Emissions Intensity 36.5 37. 3 37. 5 305-4c Scope 3 Product-Related Emissions Intensity 380 374 366 305-4c ENVIRONMENTAL UNIT OF MEASURE 2017 2018 2019 2020 2021 GRI SASB Events and Spills Environmental Events¹³ count 103 112 119 75 119 Spills beyond secondary containment¹⁴ count 21 36 27 18 26 306-3 EM-MD-160a.4 Spills beyond secondary containment - volume bbls 2,936 5,598 2,754 357 5,203 Spills to land¹⁵ bbls 2,757 5,598 1,654 132 5,149 Spills to water bbls 179 0 1,100 225 55 Spill volume recovered¹⁶ % 18 22 90 94 74 Spill volume recovered bbls 523 1,222 2,479 336 3,827 EM-MD-160a.4 Midstream Spills¹⁷ count 20 19 18 7 8 306-3 Midstream spills - volume bbls 2,869 4,648 1,403 25 157 Midstream spills to land bbls 2,567 4,624 257 5 148 Midstream spills to water bbls 179 0 1,100 0 0 Midstream spill volume recovered¹⁸ bbls 417 275 1,181 17 33 Air Emissions Total Emissions (NO x -PM-SO x -VOC) thousand metric tons 40.8 40.6 38.3 35.5 34.5 305-7a NO x thousand metric tons 12.2 12.4 12.6 11.5 11.6 PM thousand metric tons 2.9 3.2 2.7 2.3 2.5 SO x thousand metric tons 9.5 8.7 7. 8 7. 5 7. 3 VOCs thousand metric tons 16.2 16.3 15.3 14.3 13.1 Midsteam NO x thousand metric tons 0.5 0.6 0.6 0.9 0.9 EM-MD-120a.1 Midstream PM thousand metric tons 0.0 0.0 0.0 0.0 0.0 Midstream SO x thousand metric tons 0.1 0.1 0 0.1 0.0 Midstream VOCs thousand metric tons 2.2 2.4 2 2.6 2.7 Refining NO x thousand metric tons 11.7 11.8 12 10.6 10.7 EM-RM-120a.1 Refining PM thousand metric tons 2.8 3.2 2.6 2.2 2.4 Refining SO x thousand metric tons 9.5 8.6 7. 8 7. 5 7. 3 Refining VOCs thousand metric tons 12.9 12.9 12.3 10.7 10.4 63 63 PERFORMANCE DATA
 Philips 66 ESG Report Page 64 Page 66