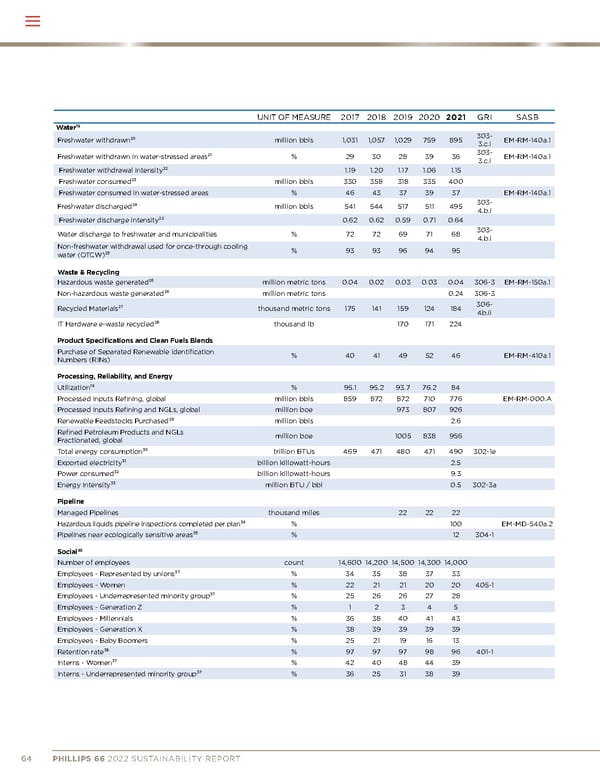
UNIT OF MEASURE 2017 2018 2019 2020 2021 GRI SASB Water 19 Freshwater withdrawn²⁰ million bbls 1,031 1,057 1,029 759 895 303- 3.c.i EM-RM-140a.1 Freshwater withdrawn in water-stressed areas²¹ % 29 30 28 39 36 303- 3.c.i EM-RM-140a.1 Freshwater withdrawal intensity²² 1.19 1.20 1.17 1.06 1.15 Freshwater consumed²³ million bbls 330 358 318 335 400 Freshwater consumed in water-stressed areas % 46 43 37 39 37 EM-RM-140a.1 Freshwater discharged²⁴ million bbls 541 544 517 511 495 303- 4.b.i Freshwater discharge intensity²² 0.62 0.62 0.59 0.71 0.64 Water discharge to freshwater and municipalities % 72 72 69 71 68 303- 4.b.i Non-freshwater withdrawal used for once-through cooling water (OTCW)²⁵ % 93 93 96 94 95 Waste & Recycling Hazardous waste generated²⁶ million metric tons 0.04 0.02 0.03 0.03 0.04 306-3 EM-RM-150a.1 Non-hazardous waste generated²⁶ million metric tons 0.24 306-3 Recycled Materials²⁷ thousand metric tons 175 141 159 124 184 306- 4b.ii IT Hardware e-waste recycled²⁸ thousand lb 170 171 224 Product Specifications and Clean Fuels Blends Purchase of Separated Renewable Identification Numbers (RINs) % 40 41 49 52 46 EM-RM-410a.1 Processing, Reliability, and Energy Utilization¹⁹ % 95.1 95.2 93.7 76.2 84 Processed Inputs Refining, global million bbls 859 872 872 710 776 EM-RM-000.A Processed Inputs Refining and NGLs, global million boe 973 807 926 Renewable Feedstocks Purchased²⁹ million bbls 2.6 Refined Petroleum Products and NGLs Fractionated, global million boe 1005 838 956 Total energy consumption³⁰ trillion BTUs 469 471 480 471 490 302-1e Exported electricity³¹ billion killowatt-hours 2.5 Power consumed³² billion killowatt-hours 9.3 Energy Intensity³³ million BTU / bbl 0.5 302-3a Pipeline Managed Pipelines thousand miles 22 22 22 Hazardous liquids pipeline inspections completed per plan³⁴ % 100 EM-MD-540a.2 Pipelines near ecologically sensitive areas³⁵ % 12 304-1 Social 36 Number of employees count 14,600 14,200 14,500 14,300 14,000 Employees - Represented by unions³⁷ % 34 35 38 37 33 Employees - Women % 22 21 21 20 20 405-1 Employees - Underrepresented minority group³⁷ % 25 26 26 27 28 Employees - Generation Z % 1 2 3 4 5 Employees - Millennials % 36 38 40 41 43 Employees - Generation X % 38 39 39 39 39 Employees - Baby Boomers % 25 21 19 16 13 Retention rate³⁸ % 97 97 97 98 96 401-1 Interns - Women³⁷ % 42 40 48 44 39 Interns - Underrepresented minority group³⁷ % 36 25 31 38 39 64 PHILLIPS 66 2022 SUSTAINABILITY REPORT
 Philips 66 ESG Report Page 65 Page 67