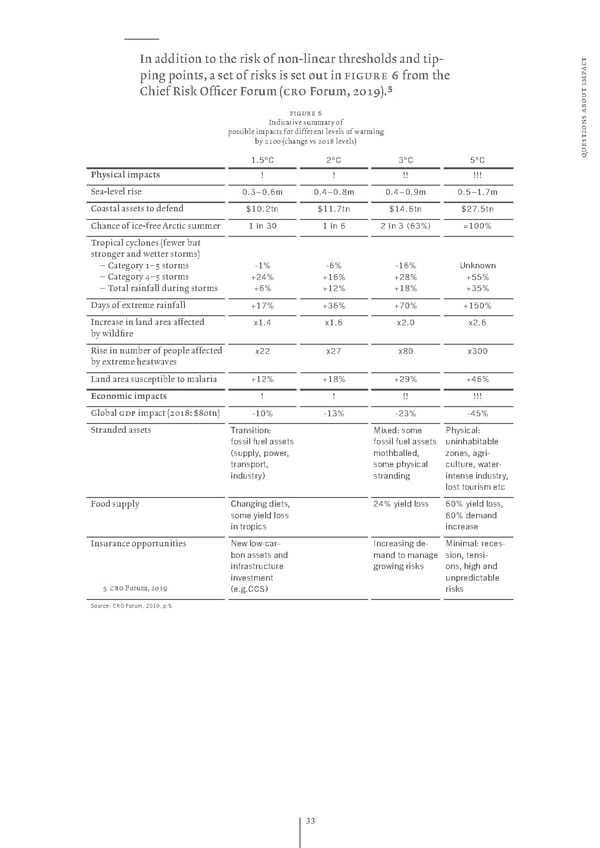
— ‹n addition to the risƒ of non„linear thresholds and tip„ t c a pin points a set of risƒs is set out in figure from the p m Chief ’isƒ Officer Žorum ›cro Žorum 201žœ‚% t i u o b figure s a ‹ndicatie summar of n o possible impacts for different leels of warmin i t b 2100 ›chane s 201— leelsœ s e u 1.5°C 2°C 3°C 5°C q ‹hysical impacts ! ! !! !!! Sea„leel rise 0.3–0.6m 0.4–0.8m 0.4–0.9m 0.5–1.7m Coastal assets to defend $10.2tn $11.7tn $14.6tn $27.5tn Chance of ice„free rctic summer 1 in 30 1 in 6 2 in 3 (63%) ≈100% …ropical cclones ›fewer but stroner and wetter stormsœ – Cateor 1–” storms -1% -6% -16% Unknown – Cateor ‘–” storms +24% +16% +28% +55% – …otal rainfall durin storms +6% +12% +18% +35% Das of extreme rainfall +17% +36% +70% +150% ‹ncrease in land area affected x1.4 x1.6 x2.0 x2.6 b wildfire ’ise in number of people affected x22 x27 x80 x300 b extreme heatwaes £and area susceptible to malaria +12% +18% +29% +46% ˆconomic impacts ! ! !! !!! Œlobal gdp impact ›201— ¸—0tnœ -10% -13% -23% -45% Stranded assets Transition: Mixed: some Physical: fossil fuel assets fossil fuel assets uninhabitable (supply, power, mothballed, zones, agri- transport, some physical culture, water - industry) stranding intense industry, lost tourism etc Žood suppl Changing diets, 24% yield loss 60% yield loss, some yield loss 60% demand in tropics increase ‹nsurance opportunities New low-car- Increasing de- Minimal: reces- bon assets and mand to manage sion, tensi- infrastructure growing risks ons, high and investment un predictable ” cro Žorum 201ž (e.g.CCS) risks Source: CRO Forum, 2019, p.5
 Pictet Group Oxford Climate Change Study Page 32 Page 34