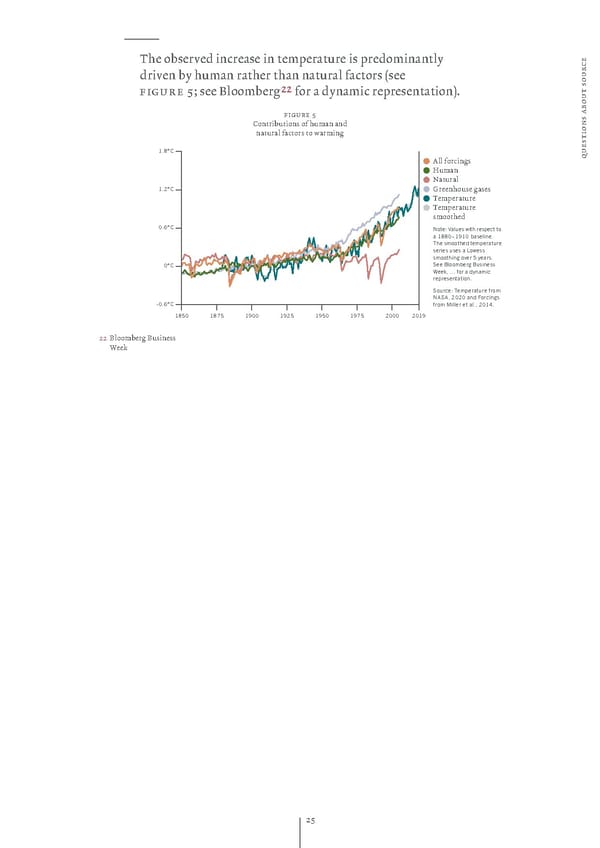
— …he obsered increase in temperature is predominantl e c drien b human rather than natural factors ›see r ou s figure ”ª see ¢loomber@@ for a dnamic representationœ‚ bout a figure 5 s Contributions of human and n o natural factors to warmin i t s 1.8°C e ll forcins qu Human “atural 1.2°C Œreenhouse ases …emperature …emperature smoothed 0.6°C Note: Values with respect to a 1880–1910 baseline. The smoothed tempera ture series uses a Lowess smoothing over 5 years. 0°C See Bloomberg Business Week, … for a dynamic representation. Source: Temperature from NASA, 2020 and Forcings -0.6°C from Miller et al., 2014. 1850 1875 1900 1925 1950 1975 2000 2019 22 ¢loomber ¢usiness Šeeƒ 2”
 Pictet Group Oxford Climate Change Study Page 24 Page 26