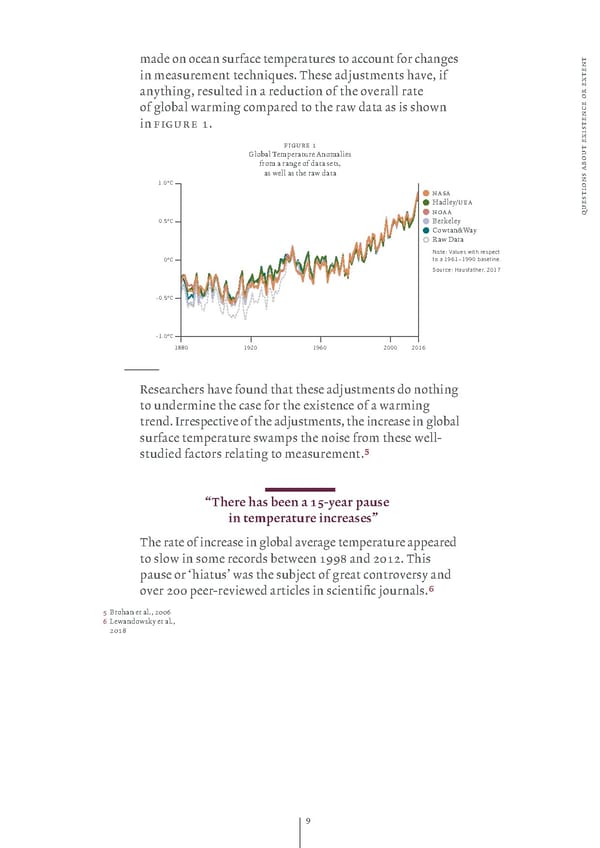
made on ocean surface temperatures to account for chanes t n in measurement techniues‚ …hese adšustments hae if e xt anthin resulted in a reduction of the oerall rate r e e o of lobal warmin compared to the raw data as is shown c n e in figure 1‚ t s i x figure 1 t e Œlobal …emperature nomalies u o from a rane of data sets b as well as the raw data s a 1.0°C n o nasa i t s Hadle¥uea e noaa u q 0.5°C ¢erƒele Cowtan¦Ša ’aw Data Note: Values with respect 0°C to a 1961–1990 baseline. Source: Hausfather, 2017 -0.5°C -1.0°C 1880 1920 1960 2000 2016 — ’esearchers hae found that these adšustments do nothin to undermine the case for the existence of a warmin trend‚ ‹rrespectie of the adšustments the increase in lobal surface temperature swamps the noise from these well„ studied factors relatin to measurement‚% — “There has been a 15year pause in temperature increases” …he rate of increase in lobal aerae temperature appeared to slow in some records between 1žž— and 2012‚ …his pause or ‘hiatus’ was the subšect of reat controers and oer 200 peer„reiewed articles in scientific šournals‚^ ” ¢rohan et al‚ 200Ÿ Ÿ £ewandowsƒ et al‚ 201— ž
 Pictet Group Oxford Climate Change Study Page 8 Page 10