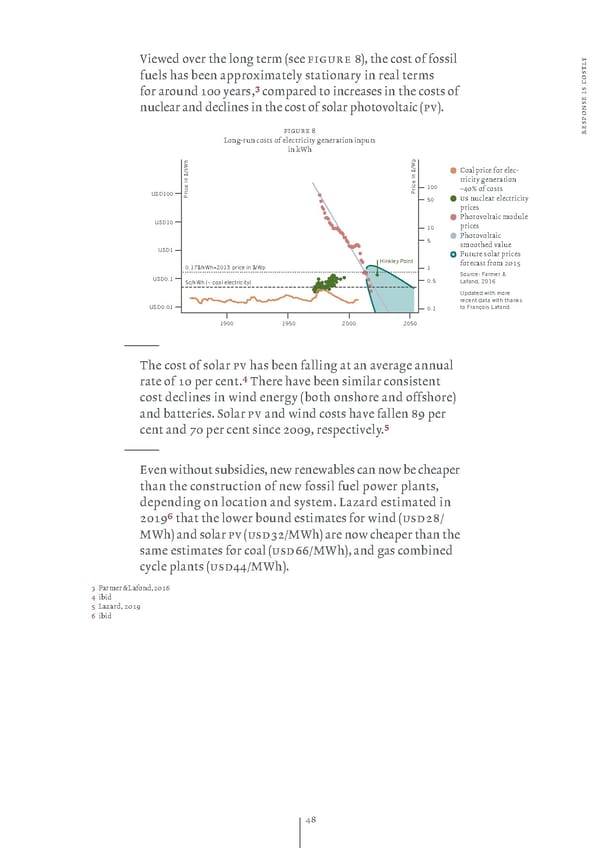
¯iewed oer the lon term ›see figure 8œ the cost of fossil ly t fuels has been approximatel stationar in real terms s o for around 100 ears # compared to increases in the costs of s c e i s nuclear and declines in the cost of solar photooltaic ›pœ‚ n o p s figure 8 e r £on„run costs of electricit eneration inputs in ƒŠh Coal price for elec„ tricit eneration 100 ¬‘0® of costs USD100 Price in $/kWh Price in $/Wp 50 us nuclear electricit prices USD10 ˆhotooltaic module 10 prices 5 ˆhotooltaic USD1 smoothed alue Žuture solar prices Hinkley Point forecast from 201” 0.17$/kWh=2013 price in $/Wp 1 USD0.1 Source: Farmer & 5c/kWh (~ coal electricity) 0.5 Lafond, 2016 Updated with more recent data with thanks USD0.01 0.1 to François Lafond. 1900 1950 2000 2050 — …he cost of solar p has been fallin at an aerae annual rate of 10 per cent‚$ …here hae been similar consistent cost declines in wind ener ›both onshore and offshoreœ and batteries‚ Solar p and wind costs hae fallen —ž per cent and ¡0 per cent since 200ž respectiel‚% — Een without subsidies new renewables can now be cheaper than the construction of new fossil fuel power plants dependin on location and sstem‚ £azard estimated in 201ž^ that the lower bound estimates for wind ›usd28¥ MŠhœ and solar p ›usd2¥MŠhœ are now cheaper than the same estimates for coal ›usdŸŸ¥MŠhœ and as combined ccle plants ›usd‘‘¥MŠhœ‚ Žarmer ¦ £afond 201Ÿ ‘ ibid ” £azard 201ž Ÿ ibid ‘—
 Pictet Group Oxford Climate Change Study Page 47 Page 49