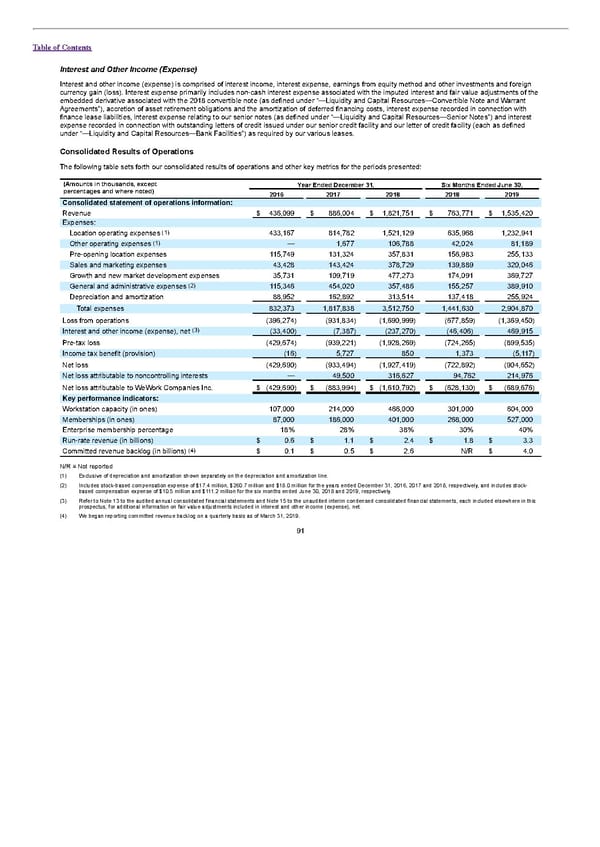
Table of Contents Interest and Other Income (Expense) Interest and other income (expense) is comprised of interest income, interest expense, earnings from equity method and other investments and foreign currency gain (loss). Interest expense primarily includes non-cash interest expense associated with the imputed interest and fair value adjustments of the embedded derivative associated with the 2018 convertible note (as defined under “—Liquidity and Capital Resources—Convertible Note and Warrant Agreements”), accretion of asset retirement obligations and the amortization of deferred financing costs, interest expense recorded in connection with finance lease liabilities, interest expense relating to our senior notes (as defined under “—Liquidity and Capital Resources—Senior Notes”) and interest expense recorded in connection with outstanding letters of credit issued under our senior credit facility and our letter of credit facility (each as defined under “—Liquidity and Capital Resources—Bank Facilities”) as required by our various leases. Consolidated Results of Operations The following table sets forth our consolidated results of operations and other key metrics for the periods presented: (Amounts in thousands, except Year Ended December 31, Six Months Ended June 30, percentages and where noted) 2016 2017 2018 2018 2019 Consolidated statement of operations information: Revenue $ 436,099 $ 886,004 $ 1,821,751 $ 763,771 $ 1,535,420 Expenses: (1) Location operating expenses 433,167 814,782 1,521,129 635,968 1,232,941 (1) Other operating expenses — 1,677 106,788 42,024 81,189 Pre-opening location expenses 115,749 131,324 357,831 156,983 255,133 Sales and marketing expenses 43,428 143,424 378,729 139,889 320,046 Growth and new market development expenses 35,731 109,719 477,273 174,091 369,727 (2) General and administrative expenses 115,346 454,020 357,486 155,257 389,910 Depreciation and amortization 88,952 162,892 313,514 137,418 255,924 Total expenses 832,373 1,817,838 3,512,750 1,441,630 2,904,870 Loss from operations (396,274) (931,834) (1,690,999) (677,859) (1,369,450) (3) Interest and other income (expense), net (33,400) (7,387) (237,270) (46,406) 469,915 Pre-tax loss (429,674) (939,221) (1,928,269) (724,265) (899,535) Income tax benefit (provision) (16) 5,727 850 1,373 (5,117) Net loss (429,690) (933,494) (1,927,419) (722,892) (904,652) Net loss attributable to noncontrolling interests — 49,500 316,627 94,762 214,976 Net loss attributable to WeWork Companies Inc. $ (429,690) $ (883,994) $ (1,610,792) $ (628,130) $ (689,676) Key performance indicators: Workstation capacity (in ones) 107,000 214,000 466,000 301,000 604,000 Memberships (in ones) 87,000 186,000 401,000 268,000 527,000 Enterprise membership percentage 18% 28% 38% 30% 40% Run-rate revenue (in billions) $ 0.6 $ 1.1 $ 2.4 $ 1.8 $ 3.3 (4) Committed revenue backlog (in billions) $ 0.1 $ 0.5 $ 2.6 N/R $ 4.0 N/R = Not reported (1) Exclusive of depreciation and amortization shown separately on the depreciation and amortization line. (2) Includes stock-based compensation expense of $17.4 million, $260.7 million and $18.0 million for the years ended December 31, 2016, 2017 and 2018, respectively, and includes stock- based compensation expense of $10.5 million and $111.2 million for the six months ended June 30, 2018 and 2019, respectively. (3) Refer to Note 13 to the audited annual consolidated financial statements and Note 15 to the unaudited interim condensed consolidated financial statements, each included elsewhere in this prospectus, for additional information on fair value adjustments included in interest and other income (expense), net. (4) We began reporting committed revenue backlog on a quarterly basis as of March 31, 2019. 91
 S1 - WeWork Prospectus Page 95 Page 97