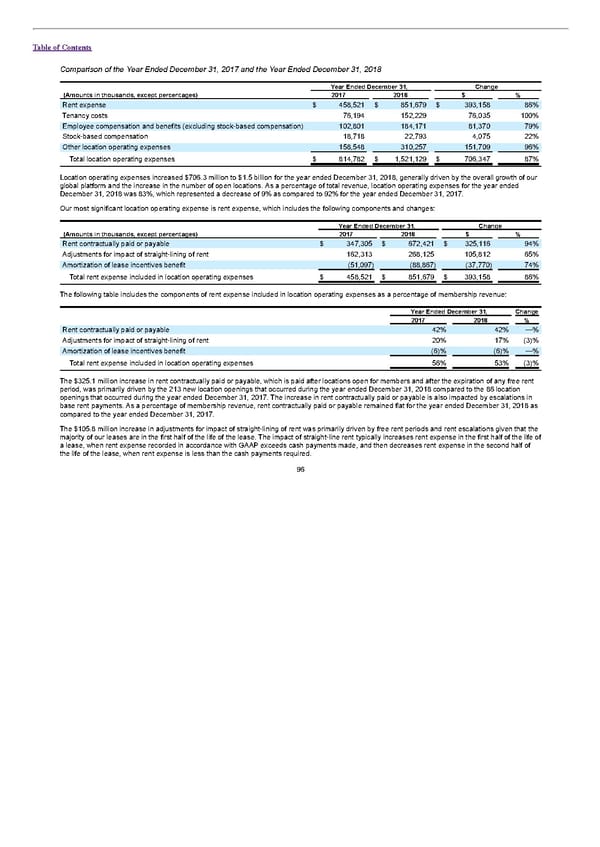
Table of Contents Comparison of the Year Ended December 31, 2017 and the Year Ended December 31, 2018 Year Ended December 31, Change (Amounts in thousands, except percentages) 2017 2018 $ % Rent expense $ 458,521 $ 851,679 $ 393,158 86% Tenancy costs 76,194 152,229 76,035 100% Employee compensation and benefits (excluding stock-based compensation) 102,801 184,171 81,370 79% Stock-based compensation 18,718 22,793 4,075 22% Other location operating expenses 158,548 310,257 151,709 96% Total location operating expenses $ 814,782 $ 1,521,129 $ 706,347 87% Location operating expenses increased $706.3 million to $1.5 billion for the year ended December 31, 2018, generally driven by the overall growth of our global platform and the increase in the number of open locations. As a percentage of total revenue, location operating expenses for the year ended December 31, 2018 was 83%, which represented a decrease of 9% as compared to 92% for the year ended December 31, 2017. Our most significant location operating expense is rent expense, which includes the following components and changes: Year Ended December 31, Change (Amounts in thousands, except percentages) 2017 2018 $ % Rent contractually paid or payable $ 347,305 $ 672,421 $ 325,116 94% Adjustments for impact of straight-lining of rent 162,313 268,125 105,812 65% Amortization of lease incentives benefit (51,097) (88,867) (37,770) 74% Total rent expense included in location operating expenses $ 458,521 $ 851,679 $ 393,158 86% The following table includes the components of rent expense included in location operating expenses as a percentage of membership revenue: Year Ended December 31, Change 2017 2018 % Rent contractually paid or payable 42% 42% —% Adjustments for impact of straight-lining of rent 20% 17% (3)% Amortization of lease incentives benefit (6)% (6)% —% Total rent expense included in location operating expenses 56% 53% (3)% The $325.1 million increase in rent contractually paid or payable, which is paid after locations open for members and after the expiration of any free rent period, was primarily driven by the 213 new location openings that occurred during the year ended December 31, 2018 compared to the 86 location openings that occurred during the year ended December 31, 2017. The increase in rent contractually paid or payable is also impacted by escalations in base rent payments. As a percentage of membership revenue, rent contractually paid or payable remained flat for the year ended December 31, 2018 as compared to the year ended December 31, 2017. The $105.8 million increase in adjustments for impact of straight-lining of rent was primarily driven by free rent periods and rent escalations given that the majority of our leases are in the first half of the life of the lease. The impact of straight-line rent typically increases rent expense in the first half of the life of a lease, when rent expense recorded in accordance with GAAP exceeds cash payments made, and then decreases rent expense in the second half of the life of the lease, when rent expense is less than the cash payments required. 96
 S1 - WeWork Prospectus Page 100 Page 102