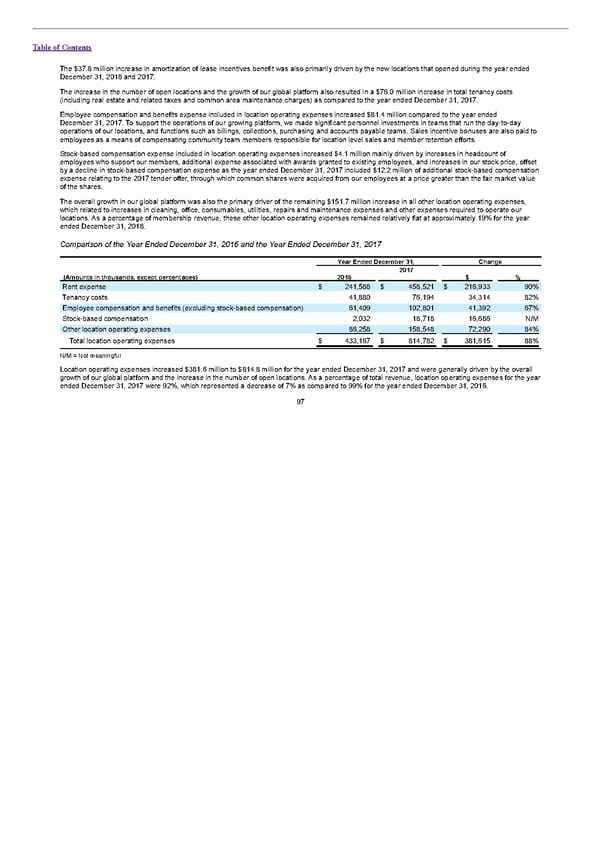
Table of Contents The $37.8 million increase in amortization of lease incentives benefit was also primarily driven by the new locations that opened during the year ended December 31, 2018 and 2017. The increase in the number of open locations and the growth of our global platform also resulted in a $76.0 million increase in total tenancy costs (including real estate and related taxes and common area maintenance charges) as compared to the year ended December 31, 2017. Employee compensation and benefits expense included in location operating expenses increased $81.4 million compared to the year ended December 31, 2017. To support the operations of our growing platform, we made significant personnel investments in teams that run the day-to-day operations of our locations, and functions such as billings, collections, purchasing and accounts payable teams. Sales incentive bonuses are also paid to employees as a means of compensating community team members responsible for location level sales and member retention efforts. Stock-based compensation expense included in location operating expenses increased $4.1 million mainly driven by increases in headcount of employees who support our members, additional expense associated with awards granted to existing employees, and increases in our stock price, offset by a decline in stock-based compensation expense as the year ended December 31, 2017 included $12.2 million of additional stock-based compensation expense relating to the 2017 tender offer, through which common shares were acquired from our employees at a price greater than the fair market value of the shares. The overall growth in our global platform was also the primary driver of the remaining $151.7 million increase in all other location operating expenses, which related to increases in cleaning, office, consumables, utilities, repairs and maintenance expenses and other expenses required to operate our locations. As a percentage of membership revenue, these other location operating expenses remained relatively flat at approximately 19% for the year ended December 31, 2018. Comparison of the Year Ended December 31, 2016 and the Year Ended December 31, 2017 Year Ended December 31, Change 2017 (Amounts in thousands, except percentages) 2016 $ % Rent expense $ 241,588 $ 458,521 $ 216,933 90% Tenancy costs 41,880 76,194 34,314 82% Employee compensation and benefits (excluding stock-based compensation) 61,409 102,801 41,392 67% Stock-based compensation 2,032 18,718 16,686 N/M Other location operating expenses 86,258 158,548 72,290 84% Total location operating expenses $ 433,167 $ 814,782 $ 381,615 88% N/M = Not meaningful Location operating expenses increased $381.6 million to $814.8 million for the year ended December 31, 2017 and were generally driven by the overall growth of our global platform and the increase in the number of open locations. As a percentage of total revenue, location operating expenses for the year ended December 31, 2017 were 92%, which represented a decrease of 7% as compared to 99% for the year ended December 31, 2016. 97
 S1 - WeWork Prospectus Page 101 Page 103