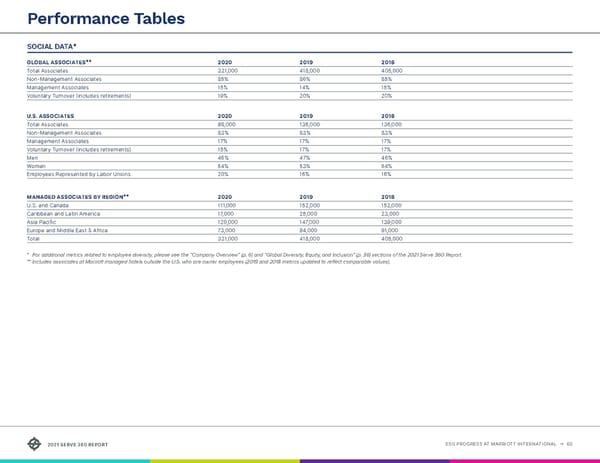
ESG PROGRESS AT MARRIOTT INTERNATIONAL → 60 ESEG PROAR TMS ORINOL SOCIAL DATA * GLOBAL ASSOCIATES ** 2020 2019 2018 Total Associates 321 ,000 4 18,000 405 ,000 Non-Management Associates 85 % 86% 85 % Management Associates 15 % 14% 15 % Voluntary Turnover (includes retirements) 19% 20% 20% U.S. ASSOCIATES 2020 2019 2018 Total Associates 98 ,000 136 ,000 136 ,000 Non-Management Associates 83% 83% 83% Management Associates 17% 17% 17% Voluntary Turnover (includes retirements) 15 % 17% 17% Men 46% 47% 46% Women 5 4% 5 3% 5 4% Employees Represented by Labor Unions 20% 16% 16% MANAGED ASSOCIATES BY REGION ** 2020 2019 2018 U.S. and Canada 111 ,000 15 2,000 15 2,000 Caribbean and Latin America 17 ,000 25 ,000 23 ,000 Asia Pacific 120 ,000 147 ,000 139 ,000 Europe and Middle East & Africa 7 3,000 94 ,000 91 ,000 Total 321 ,000 4 18,000 405 ,000 * For additional metrics related to employee diversity , please see the “Company Overview” (p. 6) and “Global Diversity, Equity, and Inclusion” (p. 36) sections of the 2021 Serve 360 Report. ** Includes associates at Marriott managed hotels outside the U .S. who are owner employees (2019 and 2018 metrics updated to reflect comparable values). Performance Tables
 Serve360 ESG Report Page 59 Page 61