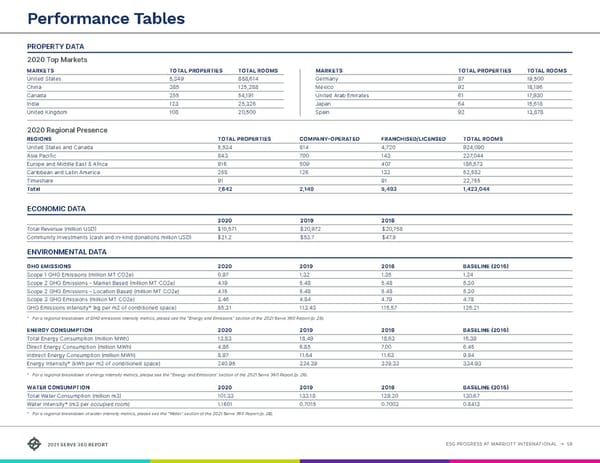
ESG PROGRESS AT MARRIOTT INTERNATIONAL → 59 2021 SERVE 360 REPORT Performance Tables PROPERTY DATA 2020 Top Markets MARKETS T OTAL PROPERTIES T OTAL ROOMS United States 5 ,349 888 ,614 China 385 125 ,288 Canada 25 5 5 4,191 India 123 25 ,326 United Kingdom 108 20 ,500 MARKETS T OTAL PROPERTIES T OTAL ROOMS Germany 87 19 ,500 Mexico 92 18 ,196 United Arab Emirates 61 17 ,930 Japan 64 15 ,618 Spain 92 13 ,878 2020 Regional Presence REGIONS T OTAL PROPERTIES COMP ANY-OPERATED FR ANCHISED/LICENSED T OTAL ROOMS United States and Canada 5 ,534 814 4 ,720 92 4,090 Asia Pacific 843 7 00 143 237 ,044 Europe and Middle East & Africa 916 5 09 40 7 186 ,573 Caribbean and Latin America 258 126 132 5 2,582 Timeshare 91 91 22, 755 Total 7 ,642 2, 149 5 ,493 1 ,423,044 ECONOMIC DATA 2020 2019 2018 Total Revenue (million USD) $10 ,571 $20 ,972 $20 ,758 Community Investments (cash and in-kind donations million USD) $21 .2 $5 3.7 $47 .9 ENVIRONMENTAL DATA GHG EMISSIONS 2020 2019 2018 B ASELINE (2016) Scope 1 GHG Emissions (million MT CO2e) 0 .97 1 .32 1 .35 1 .24 Scope 2 GHG Emissions – Market Based (million MT CO2e) 4 .19 5 .48 5 .48 5 .30 Scope 2 GHG Emissions – Location Based (million MT CO2e) 4 .15 5 .48 5 .48 5 .30 Scope 3 GHG Emissions (million MT CO2e) 3 .46 4 .84 4 .79 4 .78 GHG Emissions Intensity* (kg per m2 of conditioned space) 85 .31 113 .43 115 .57 126 .21 * For a regional break down of GHG emissions intensity metrics, please see the “Energy and Emissions” section of the 2021 Serve 360 Report (p. 25). ENERGY CONSUMPTION 2020 2019 2018 B ASELINE (2016) Total Energy Consumption (million MWh) 13 .83 18 .49 18 .63 16 .39 Direct Energy Consumption (million MWh) 4 .86 6 .85 7 .00 6 .45 Indirect Energy Consumption (million MWh) 8 .97 11 .64 11 .63 9 .94 Energy Intensity* (kWh per m2 of conditioned space) 2 40.95 32 4.39 329 .33 334 .93 * For a regional break down of energy intensity metrics, please see the “Energy and Emissions” section of the 2021 Serve 360 Report (p. 26). WATER CONSUMPTION 2020 2019 2018 B ASELINE (2016) Total Water Consumption (million m3) 101 .33 133 .18 129 .20 130 .67 Water Intensity* (m3 per occupied room) 1 .1601 0 .7015 0 .7003 0 .8413 * For a regional break down of water intensity metrics, please see the “Water” section of the 2021 Serve 360 Report (p. 28).
 Serve360 ESG Report Page 58 Page 60