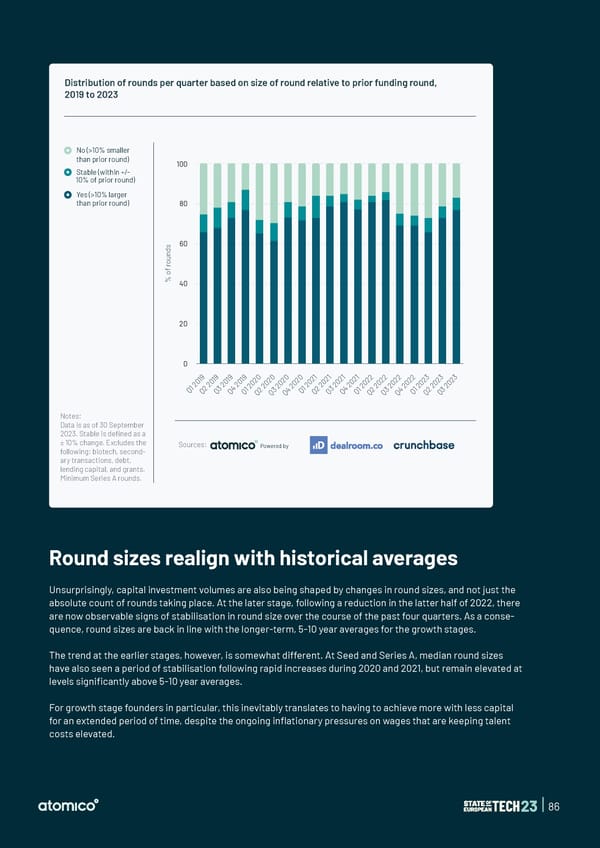
Distribution of rounds per quarter based on size of round relative to prior funding round, 2019 to 2023 No (>10% smaller than prior round) 100 Stable (within +/- 10% of prior round) Yes (>10% larger than prior round) 80 s 60 d n u o r f o % 40 20 0 9 9 9 9 0 0 0 0 1 1 1 1 2 2 2 2 3 3 3 1 1 1 1 2 2 2 2 2 2 2 2 2 2 2 2 2 2 2 0 0 0 0 0 0 0 0 0 0 0 0 0 0 0 0 0 0 0 1 2 2 2 2 2 2 2 2 2 2 2 2 2 2 2 2 2 2 2 Q 2 3 4 1 2 3 4 1 2 3 4 1 2 3 4 1 2 3 Q Q Q Q Q Q Q Q Q Q Q Q Q Q Q Q Q Q Notes: Data is as of 30 September 2023. Stable is defined as a ± 10% change. Excludes the following: biotech, second- Sources: Powered by ary transactions, debt, lending capital, and grants. Minimum Series A rounds. Round sizes realign with historical averages Unsurprisingly, capital investment volumes are also being shaped by changes in round sizes, and not just the absolute count of rounds taking place. At the later stage, following a reduction in the latter half of 2022, there are now observable signs of stabilisation in round size over the course of the past four quarters. As a conse- quence, round sizes are back in line with the longer-term, 5-10 year averages for the growth stages. The trend at the earlier stages, however, is somewhat different. At Seed and Series A, median round sizes have also seen a period of stabilisation following rapid increases during 2020 and 2021, but remain elevated at levels signi昀椀cantly above 5-10 year averages. For growth stage founders in particular, this inevitably translates to having to achieve more with less capital for an extended period of time, despite the ongoing in昀氀ationary pressures on wages that are keeping talent costs elevated. | 86
 State of European Tech | 2023 Page 85 Page 87