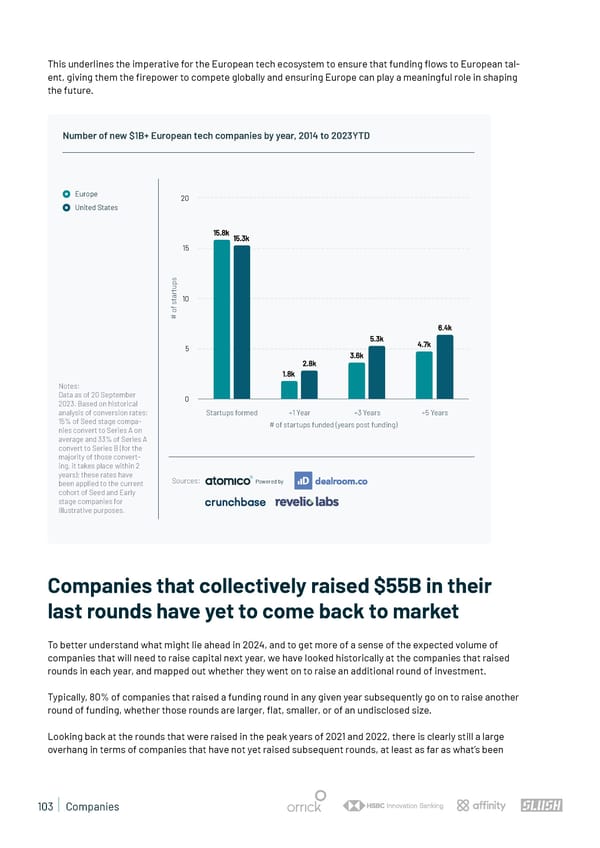
This underlines the imperative for the European tech ecosystem to ensure that funding 昀氀ows to European tal- ent, giving them the 昀椀repower to compete globally and ensuring Europe can play a meaningful role in shaping the future. Number of new $1B+ European tech companies by year, 2014 to 2023YTD Europe 20 United States 15.8k 15.3k 15 s p u t r a t 10 s f o # 6.4k 5.3k 4.7k 5 3.6k 2.8k 1.8k Notes: Data as of 20 September 0 2023. Based on historical analysis of conversion rates: Startups formed +1 Year +3 Years +5 Years 15% of Seed stage compa- # of startups funded (years post funding) nies convert to Series A on average and 33% of Series A convert to Series B (for the majority of those convert- ing, it takes place within 2 years); these rates have Sources: been applied to the current Powered by cohort of Seed and Early stage companies for illustrative purposes. Companies that collectively raised $55B in their last rounds have yet to come back to market To better understand what might lie ahead in 2024, and to get more of a sense of the expected volume of companies that will need to raise capital next year, we have looked historically at the companies that raised rounds in each year, and mapped out whether they went on to raise an additional round of investment. Typically, 80% of companies that raised a funding round in any given year subsequently go on to raise another round of funding, whether those rounds are larger, 昀氀at, smaller, or of an undisclosed size. Looking back at the rounds that were raised in the peak years of 2021 and 2022, there is clearly still a large overhang in terms of companies that have not yet raised subsequent rounds, at least as far as what’s been 103 | Companies
 State of European Tech | 2023 Page 102 Page 104