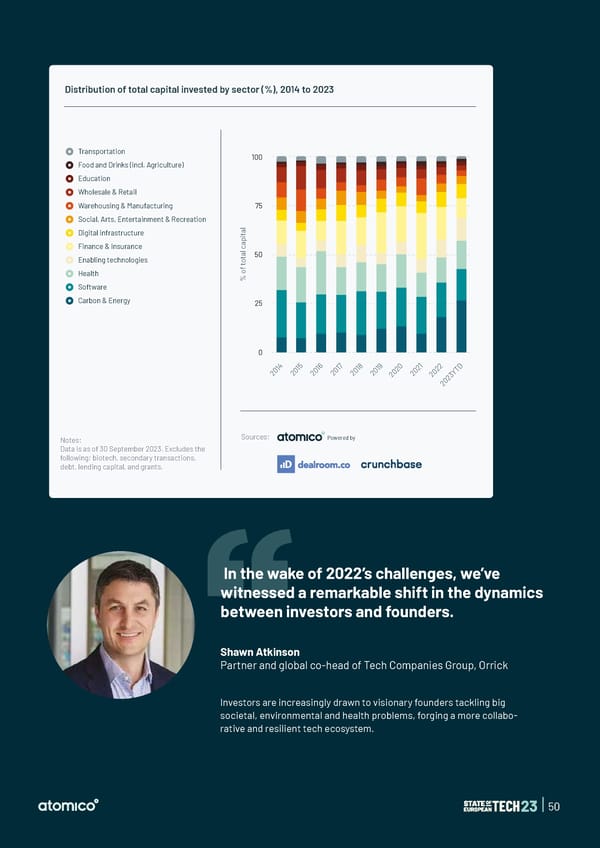
Distribution of total capital invested by sector (%), 2014 to 2023 Transportation 100 Food and Drinks (incl. Agriculture) Education Wholesale & Retail Warehousing & Manufacturing 75 Social, Arts, Entertainment & Recreation l Digital infrastructure a t i p Finance & Insurance a c l a 50 Enabling technologies t o t f o Health Software % Carbon & Energy 25 0 4 5 6 7 8 9 0 1 2 D 1 1 1 1 1 1 2 2 2 T 0 0 0 0 0 0 0 0 0 Y 2 2 2 2 2 2 2 2 2 3 2 0 2 Notes: Sources: Powered by Data is as of 30 September 2023. Excludes the following: biotech, secondary transactions, debt, lending capital, and grants. In the wake of 2022’s challenges, we’ve witnessed a remarkable shift in the dynamics between investors and founders. Shawn Atkinson Partner and global co-head of Tech Companies Group, Orrick Investors are increasingly drawn to visionary founders tackling big societal, environmental and health problems, forging a more collabo- rative and resilient tech ecosystem. | 50
 State of European Tech | 2023 Page 49 Page 51