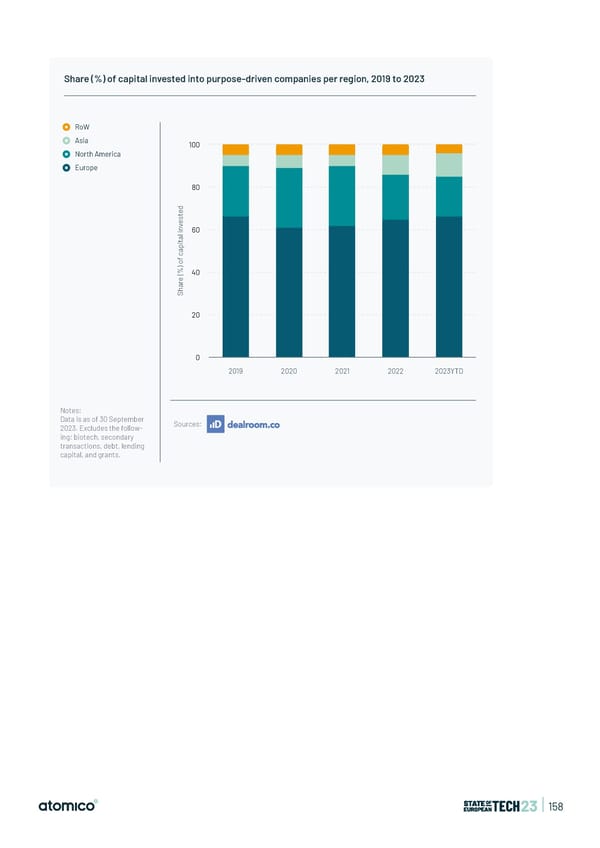
Share (%) of capital invested into purpose-driven companies per region, 2019 to 2023 RoW Asia 100 North America Europe 80 d e t s e v n 60 i l a t i p a c f o ) % 40 ( e r a h S 20 0 2019 2020 2021 2022 2023YTD Notes: Data is as of 30 September Sources: 2023. Excludes the follow- ing: biotech, secondary transactions, debt, lending capital, and grants. | 158
 State of European Tech | 2023 Page 157 Page 159