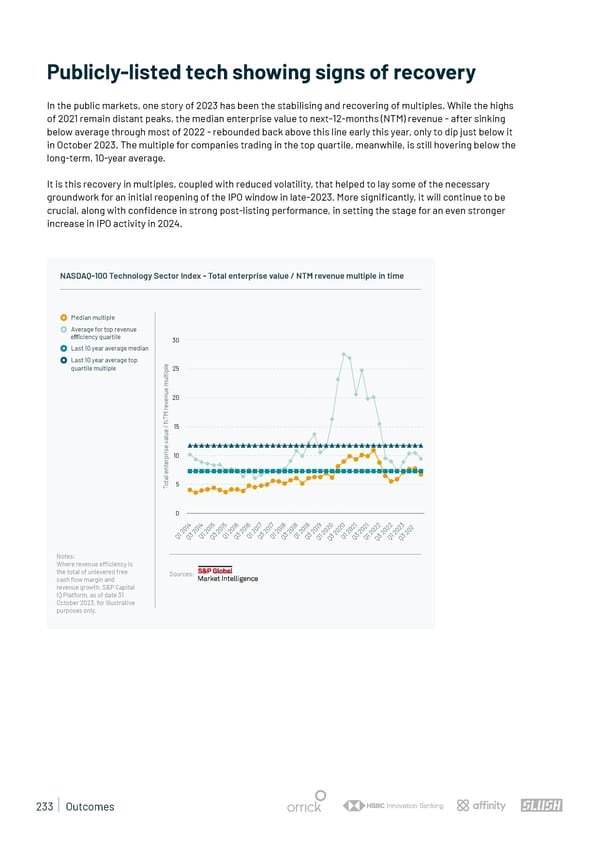
Publicly-listed tech showing signs of recovery In the public markets, one story of 2023 has been the stabilising and recovering of multiples. While the highs of 2021 remain distant peaks, the median enterprise value to next-12-months (NTM) revenue - after sinking below average through most of 2022 - rebounded back above this line early this year, only to dip just below it in October 2023. The multiple for companies trading in the top quartile, meanwhile, is still hovering below the long-term, 10-year average. It is this recovery in multiples, coupled with reduced volatility, that helped to lay some of the necessary groundwork for an initial reopening of the IPO window in late-2023. More signi昀椀cantly, it will continue to be crucial, along with con昀椀dence in strong post-listing performance, in setting the stage for an even stronger increase in IPO activity in 2024. NASDAQ-100 Technology Sector Index - Total enterprise value / NTM revenue multiple in time Median multiple Average for top revenue e ciency quartile 30 Last 10 year average median Last 10 year average top e quartile multiple l25 p i t l u m e u n e20 v e r M T N / 15 e u l a v e s i r 10 p r e t n e l a t o 5 T 0 1 5 5 6 6 7 7 8 8 9 9 1 3 4 4 2 2 0 0 1 1 1 1 1 1 1 1 1 1 2 1 1 2 2 2 2 2 2 2 0 0 0 0 0 0 0 0 0 0 0 0 0 0 0 0 0 0 0 2 0 2 2 2 2 2 2 2 2 2 2 2 2 2 2 2 2 2 2 2 1 3 1 3 1 3 1 3 1 3 1 3 1 1 3 1 1 3 3 Q Q Q Q Q Q Q Q Q Q Q Q Q Q3 Q Q Q Q Q Q Notes: Where revenue e昀케ciency is the total of unlevered free Sources: cash flow margin and revenue growth. S&P Capital IQ Platform, as of date 31 October 2023, for illustrative purposes only. 233 | Outcomes
 State of European Tech | 2023 Page 232 Page 234