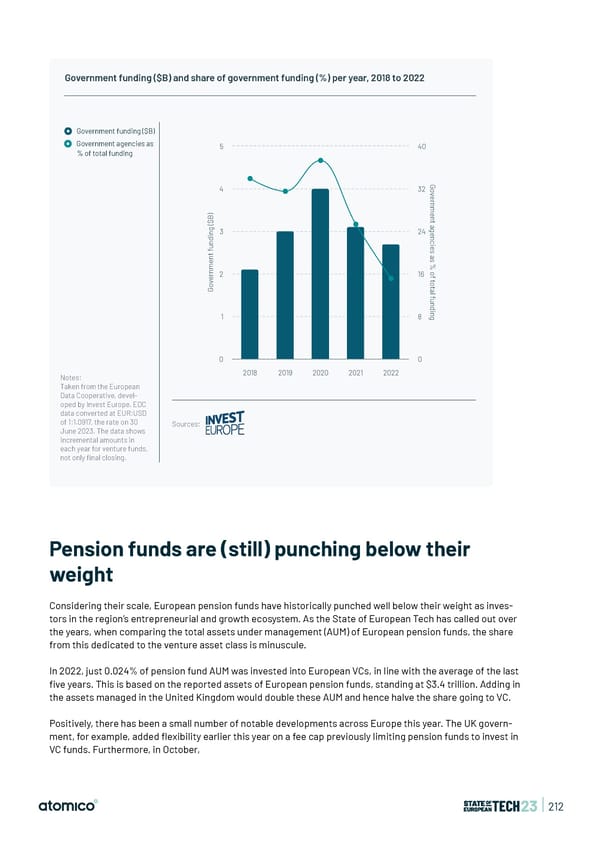
Government funding ($B) and share of government funding (%) per year, 2018 to 2022 Government funding ($B) Government agencies as 5 40 % of total funding G 4 32 o v e r n m ) e B n t $ ( a g g n 3 24 e i n d c n i u e f s t a n s e m % n o r 2 16 f e t v o o t G a l f u n d i n 1 8 g 0 0 Notes: 2018 2019 2020 2021 2022 Taken from the European Data Cooperative, devel- oped by Invest Europe. EDC data converted at EUR:USD of 1:1.0917, the rate on 30 Sources: June 2023. The data shows incremental amounts in each year for venture funds, not only final closing. Pension funds are (still) punching below their weight Considering their scale, European pension funds have historically punched well below their weight as inves- tors in the region’s entrepreneurial and growth ecosystem. As the State of European Tech has called out over the years, when comparing the total assets under management (AUM) of European pension funds, the share from this dedicated to the venture asset class is minuscule. In 2022, just 0.024% of pension fund AUM was invested into European VCs, in line with the average of the last 昀椀ve years. This is based on the reported assets of European pension funds, standing at $3.4 trillion. Adding in the assets managed in the United Kingdom would double these AUM and hence halve the share going to VC. Positively, there has been a small number of notable developments across Europe this year. The UK govern- ment, for example, added 昀氀exibility earlier this year on a fee cap previously limiting pension funds to invest in VC funds. Furthermore, in October, | 212
 State of European Tech | 2023 Page 211 Page 213