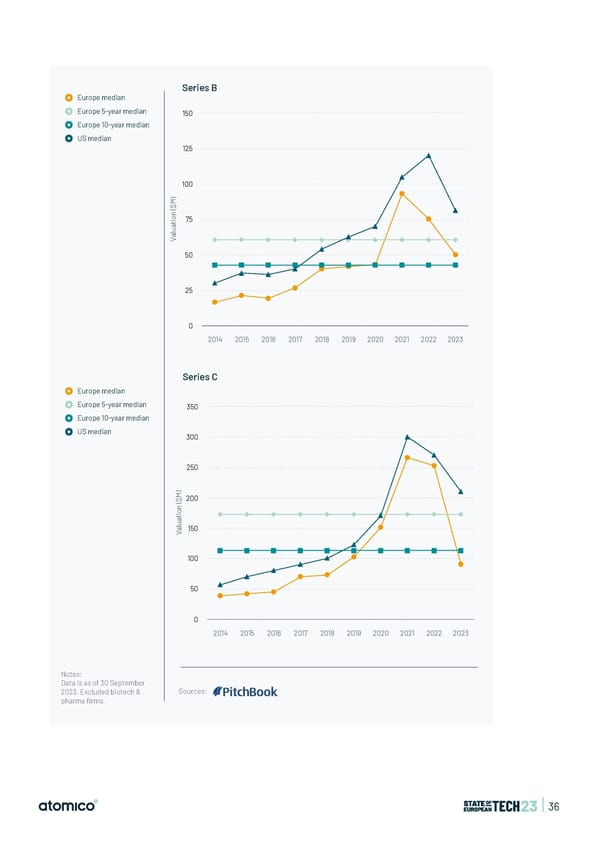
Series B Private and public markets ecosystem value ($T), 2014 to 2023 Europe median Europe 5-year median 150 Europe 10-year median Public US median Private 125 4 100 ) M $ ( 3 n o i 75 t ) a T u l $ a ( V e u l a v 50 2 m e t s y s o c 25 E 1 0 2014 2015 2016 2017 2018 2019 2020 2021 2022 2023 0 4 5 6 17 8 9 0 1 2 D 1 1 1 0 1 1 2 2 2 T Series C 0 0 0 2 0 0 0 0 0 Y 2 2 2 2 2 2 2 2 3 2 Notes: 0 Europe median 2 Private market data from Europe 5-year median Dealroom.co excludes the following: 350 biotech, secondary transactions, Europe 10-year median debt, lending capital, and grants. US median Based on data up to 30 September 300 Sources: 2023. Public markets data as per S&P Capital IQ Platform, as of date 31 October 2023, for illustrative purposes only. 250 ) M200 $ ( n o i t a u l 150 a V 100 50 0 2014 2015 2016 2017 2018 2019 2020 2021 2022 2023 Notes: Data is as of 30 September 2023. Excluded biotech & Sources: pharma firms. | 36
 State of European Tech | 2023 Page 35 Page 37