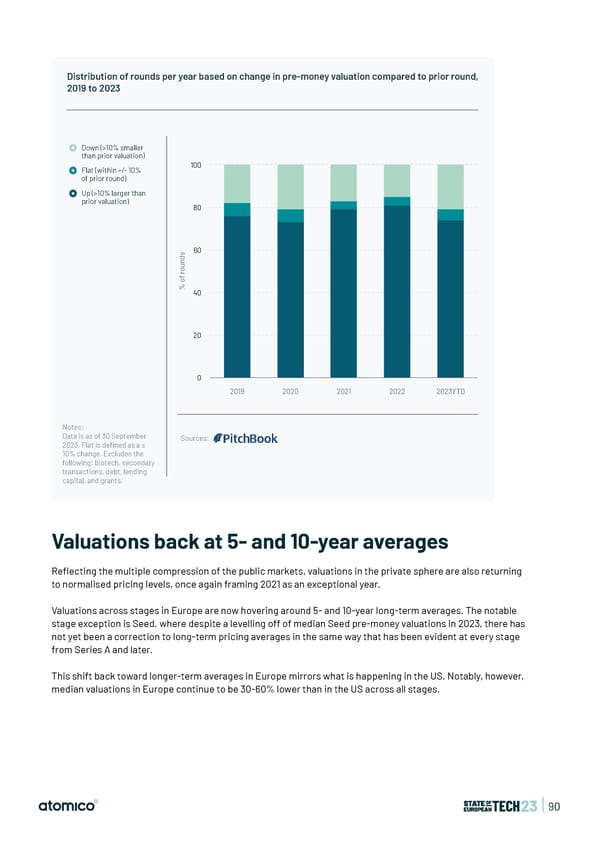
Distribution of rounds per year based on change in pre-money valuation compared to prior round, 2019 to 2023 Down (>10% smaller than prior valuation) Flat (within +/- 10% 100 of prior round) Up (>10% larger than prior valuation) 80 s 60 d n u o r f o % 40 20 0 2019 2020 2021 2022 2023YTD Notes: Data is as of 30 September Sources: 2023. Flat is defined as a ± 10% change. Excludes the following: biotech, secondary transactions, debt, lending capital, and grants. Valuations back at 5- and 10-year averages Re昀氀ecting the multiple compression of the public markets, valuations in the private sphere are also returning to normalised pricing levels, once again framing 2021 as an exceptional year. Valuations across stages in Europe are now hovering around 5- and 10-year long-term averages. The notable stage exception is Seed, where despite a levelling off of median Seed pre-money valuations in 2023, there has not yet been a correction to long-term pricing averages in the same way that has been evident at every stage from Series A and later. This shift back toward longer-term averages in Europe mirrors what is happening in the US. Notably, however, median valuations in Europe continue to be 30-60% lower than in the US across all stages. | 90
 State of European Tech | 2023 Page 89 Page 91