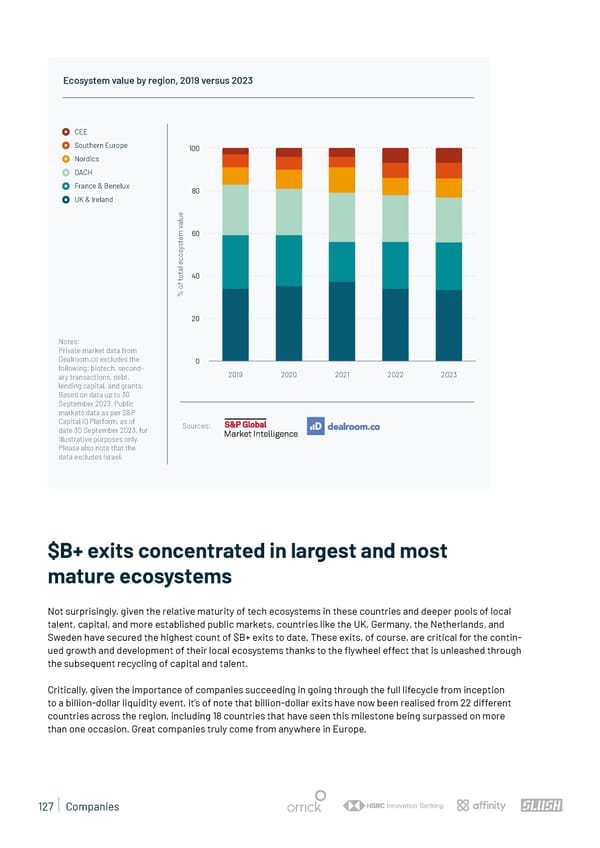
Ecosystem value by region, 2019 versus 2023 CEE Southern Europe 100 Nordics DACH France & Benelux 80 UK & Ireland e u l a v 60 m e t s y s o c e l a t o 40 t f o % 20 Notes: Private market data from Dealroom.co excludes the 0 following: biotech, second- 2019 2020 2021 2022 2023 ary transactions, debt, lending capital, and grants. Based on data up to 30 September 2023. Public markets data as per S&P Capital IQ Platform, as of Sources: date 30 September 2023, for illustrative purposes only. Please also note that the data excludes Israel. $B+ exits concentrated in largest and most mature ecosystems Not surprisingly. given the relative maturity of tech ecosystems in these countries and deeper pools of local talent, capital, and more established public markets, countries like the UK, Germany, the Netherlands, and Sweden have secured the highest count of $B+ exits to date. These exits, of course, are critical for the contin- ued growth and development of their local ecosystems thanks to the 昀氀ywheel effect that is unleashed through the subsequent recycling of capital and talent. Critically, given the importance of companies succeeding in going through the full lifecycle from inception to a billion-dollar liquidity event, it’s of note that billion-dollar exits have now been realised from 22 different countries across the region, including 18 countries that have seen this milestone being surpassed on more than one occasion. Great companies truly come from anywhere in Europe. 127 | Companies
 State of European Tech | 2023 Page 126 Page 128