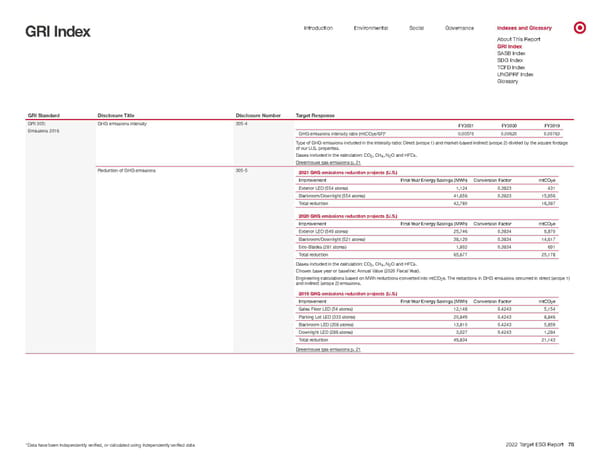
0 Introduction Environmental Social Governance Indexes and Glossary GRI Index About This Report GRI Index SASB Index SDG Index TCFD Index UNGPRF Index Glossary GRI Standard Disclosure Title Disclosure Number Target Response GRI 305: Emissions 2016 GHG emissions intensity 305-4 FY2021 FY2020 FY2019 GHG emissions intensity ratio (mtCO 2 e/SF)* 0.00570 0.00620 0.00763 Type of GHG emissions included in the intensity ratio: Direct (scope 1) and market-based indirect (scope 2) divided by the square footage of our U .S. properties. Gases included in the calculation: CO 2 , CH 4 , N 2 O and HFCs. Greenhouse gas emissions p. 21 Reduction of GHG emissions 305-5 2021 GHG emissions reduction projects (U.S.) Improvement First-Year Energy Savings (MWh) Conversion Factor mtCO 2 e Exterior LED (554 stores) 1,124 0.3823 431 Backroom/Downlight (554 stores) 41,656 0.3823 15,956 Total reduction 42,780 16,387 2020 GHG emissions reduction projects (U.S.) Improvement First-Year Energy Savings (MWh) Conversion Factor mtCO 2 e Exterior LED (549 stores) 25,746 0.3834 9,870 Backroom/Downlight (521 stores) 38,129 0.3834 14,617 Eco-Blades (281 stores) 1,802 0.3834 691 Total reduction 65,677 25,178 Gases included in the calculation: CO 2 , CH 4 , N 2 O and HFCs. Chosen base year or baseline: Annual Value (2020 Fiscal Year). Engineering calculations based on MWh reductions converted into mtCO 2 e. The reductions in GHG emissions occurred in direct (scope 1) and indir ect (scope 2) emissions. 2019 GHG emissions reduction projects (U.S.) Improvement First-Year Energy Savings (MWh) Conversion Factor mtCO 2 e Sales Floor LED (54 stores) 12,148 0.4243 5,154 Parking Lot LED (333 stores) 20,849 0.4243 8,846 Backroom LED (208 stores) 13,810 0.4243 5,859 Downlight LED (286 stores) 3,027 0.4243 1,284 Total reduction 49,834 21,143 Greenhouse gas emissions p. 21 *Data have been independently verified, or calculated using independently verified data. 2022 Target ESG Report 78 Emissions
 Target ESG Report Page 77 Page 79