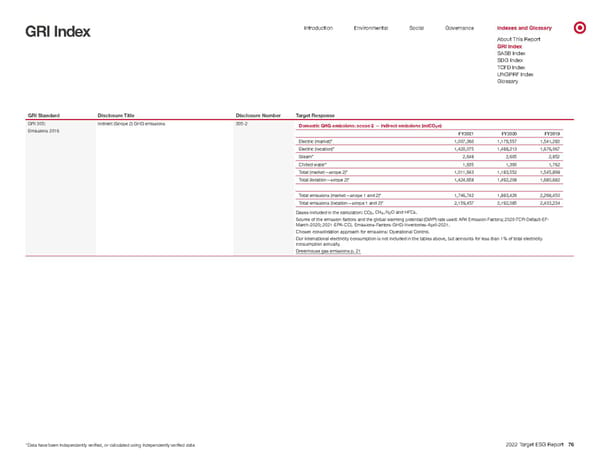
0 Introduction Environmental Social Governance Indexes and Glossary GRI Index About This Report GRI Index SASB Index SDG Index TCFD Index UNGPRF Index Glossary GRI Standard Disclosure Title Disclosure Number Target Response GRI 305: Emissions 2016 Indirect (Scope 2) GHG emissions 305-2 Domestic GHG emissions: scope 2 — indirect emissions (mtCO 2 e) Electric (market)* 1,007,360 1,179,557 1,541,283 Electric (location)* 1,420,075 1,488,213 1,676,067 Steam* 2,648 2,605 2,852 Chilled water* 1,935 1,390 1,762 Total (market—scope 2)* 1,011,943 1,183,552 1,545,898 Total (location—scope 2)* 1,424,658 1,492,208 1,680,682 FY2021 FY2020 FY2019 Total emissions (market—scope 1 and 2)* 1,746,742 1,883,429 2,298,450 Total emissions (location—scope 1 and 2)* 2,159,457 2,192,085 2,433,234 Gases included in the calculation: CO 2 , CH 4 , N 2 O and HFCs. Source of the emission factors and the global warming potential (GWP) rate used: AR4 Emission Factors; 2020-TCR-Default-EF- Mar ch-2020; 2021-EPA-CCL Emissions-Factors-GHG-Inventories-April-2021. Chosen consolidation approach for emissions: Operational Control. Our international electricity consumption is not included in the tables above, but accounts for less than 1% of total electricity consumption annually . Greenhouse gas emissions p. 21 *Data have been independently verified, or calculated using independently verified data. 2022 Target ESG Report 76 Emissions
 Target ESG Report Page 75 Page 77