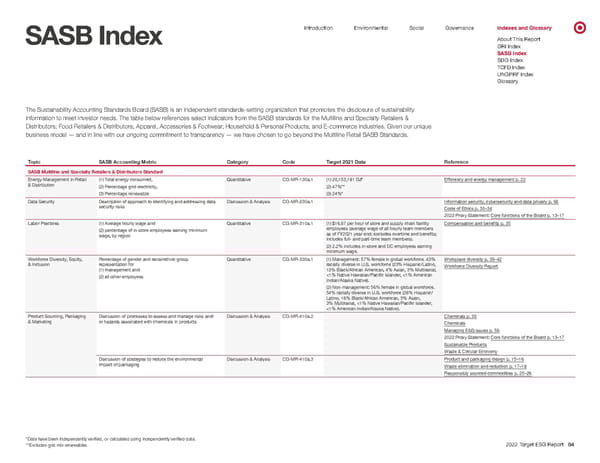
0 Introduction Environmental Social Governance Indexes and Glossary About This Report SASB Index GRI Index SASB Index SDG Index TCFD Index UNGPRF Index Glossary The Sustainability Accounting Standards Board (SASB) is an independent standards-setting organization that promotes the disclosure of sustainability information to meet investor needs. The table below references select indicators from the SASB standards for the Multiline and Specialty Retailers & Distributors; Food Retailers & Distributors; Apparel, Accessories & Footwear; Household & Personal Products; and E-commerce industries. Given our unique business model — and in line with our ongoing commitment to transparency — we have chosen to go beyond the Multiline Retail SASB Standards. Topic SASB Accounting Metric Category Code Target 2021 Data Reference SASB Multiline and Specialty Retailers & Distributors Standard Energy Management in Retail & Distribution (1) Total energy consumed, (2) Percentage grid electricity, (3) Percentage renewable Quantitative CG-MR-130a.1 (1) 20,153,181 GJ * (2) 47% ** (3) 24% * Efficiency and energy management p. 22 Data Security Description of approach to identifying and addressing data security risks Discussion & Analysis CG-MR-230a.1 Information security, cybersecurity and data privacy p. 60 Code of Ethics p. 30–34 2022 Proxy Statement: Core functions of the Board p. 13–17 Labor Practices (1) Average hourly wage and (2) percentage of in-store employees earning minimum wage, by region Quantitative CG-MR-310a.1 (1) $16.97 per hour of store and supply chain facility employees (average wage of all hourly team members as of FY2021 year end; excludes overtime and benefits; includes full- and part-time team members). (2) 2.2% includes in-store and DC employees earning minimum wage. Compensation and benefits p. 35 Workforce Diversity, Equity, & Inclusion Percentage of gender and racial/ethnic group representation for (1) management and (2) all other employees Quantitative CG-MR-330a.1 (1) Management: 57% female in global workforce. 43% racially diverse in U.S. workforce (23% Hispanic/Latino, 13% Black/African American, 4% Asian, 3% Multiracial, <1% Native Hawaiian/Pacific Islander, <1% American Indian/Alaska Native). (2) Non-management: 56% female in global workforce. 54% racially diverse in U.S. workforce (28% Hispanic/ Latino, 16% Black/African American, 5% Asian, 3% Multiracial, <1% Native Hawaiian/Pacific Islander, <1% American Indian/Alaska Native). Workplace diversity p. 39–42 Workforce Diversity Report Product Sourcing, Packaging & Marketing Discussion of processes to assess and manage risks and/ or hazards associated with chemicals in products Discussion & Analysis CG-MR-410a.2 Chemicals p. 30 Chemicals Managing ESG issues p. 56 2022 Proxy Statement: Core functions of the Board p. 13–17 Sustainable Products Waste & Circular Economy Discussion of strategies to reduce the environmental impact of packaging Discussion & Analysis CG-MR-410a.3 Product and packaging design p. 15–16 Waste elimination and reduction p. 17–18 Responsibly sourced commodities p. 25–26 * Data have been independently verified, or calculated using independently verified data. ** Excludes grid mix renewables. 2022 Target ESG Report 84
 Target ESG Report Page 83 Page 85