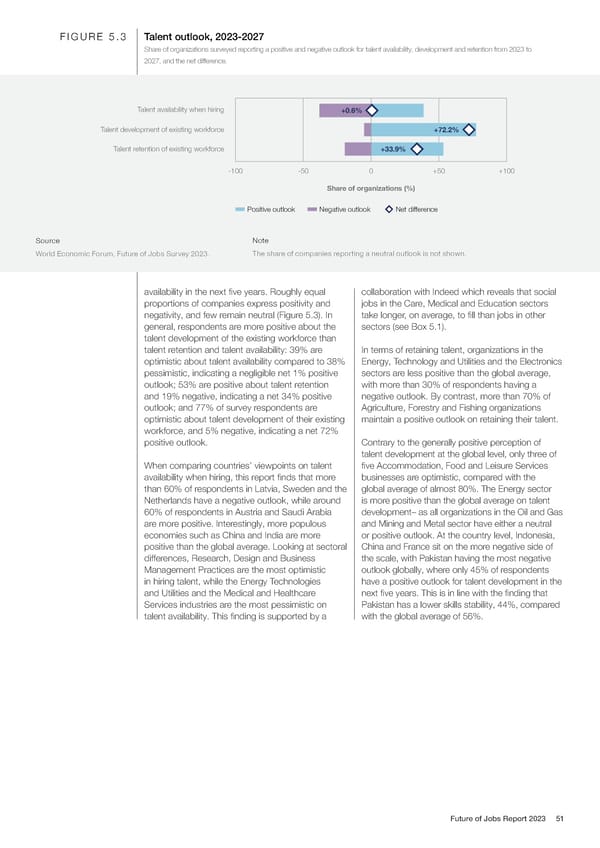
FIGURE 5.3 Talent outlook, 2023-2027 Share of organizations surveyed reporting a positive and negative outlook for talent availability, development and retention from 2023 to 2027, and the net difference. Talent availability when hiring +0.6% Talent development of existing workforce +72.2% Talent retention of existing workforce +33.9% -100 -50 0 +50 +100 Share of organizations (%) Positive outlook Negative outlook Net difference Source Note World Economic Forum, Future of Jobs Survey 2023. The share of companies reporting a neutral outlook is not shown. availability in the next five years. Roughly equal collaboration with Indeed which reveals that social proportions of companies express positivity and jobs in the Care, Medical and Education sectors negativity, and few remain neutral (Figure 5.3). In take longer, on average, to fill than jobs in other general, respondents are more positive about the sectors (see Box 5.1). talent development of the existing workforce than talent retention and talent availability: 39% are In terms of retaining talent, organizations in the optimistic about talent availability compared to 38% Energy, Technology and Utilities and the Electronics pessimistic, indicating a negligible net 1% positive sectors are less positive than the global average, outlook; 53% are positive about talent retention with more than 30% of respondents having a and 19% negative, indicating a net 34% positive negative outlook. By contrast, more than 70% of outlook; and 77% of survey respondents are Agriculture, Forestry and Fishing organizations optimistic about talent development of their existing maintain a positive outlook on retaining their talent. workforce, and 5% negative, indicating a net 72% positive outlook. Contrary to the generally positive perception of talent development at the global level, only three of When comparing countries’ viewpoints on talent five Accommodation, Food and Leisure Services availability when hiring, this report finds that more businesses are optimistic, compared with the than 60% of respondents in Latvia, Sweden and the global average of almost 80%. The Energy sector Netherlands have a negative outlook, while around is more positive than the global average on talent 60% of respondents in Austria and Saudi Arabia development– as all organizations in the Oil and Gas are more positive. Interestingly, more populous and Mining and Metal sector have either a neutral economies such as China and India are more or positive outlook. At the country level, Indonesia, positive than the global average. Looking at sectoral China and France sit on the more negative side of differences, Research, Design and Business the scale, with Pakistan having the most negative Management Practices are the most optimistic outlook globally, where only 45% of respondents in hiring talent, while the Energy Technologies have a positive outlook for talent development in the and Utilities and the Medical and Healthcare next five years. This is in line with the finding that Services industries are the most pessimistic on Pakistan has a lower skills stability, 44%, compared talent availability. This finding is supported by a with the global average of 56%. Future of Jobs Report 2023 51
 The Future of Jobs Report 2023 Page 50 Page 52