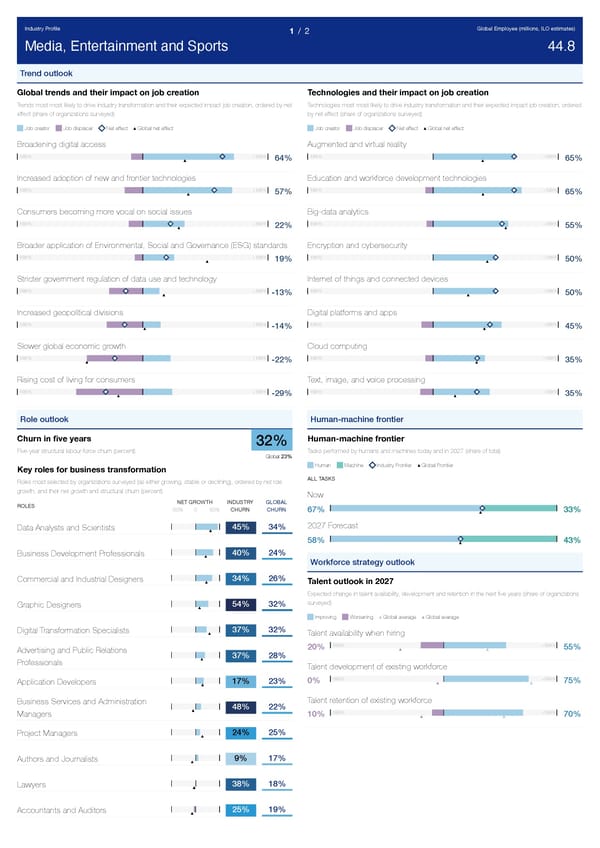
Industry Profile Global Employee (millions, ILO estimates) 1 / 2 Media, Entertainment and Sports 44.8 Trend outlook Global trends and their impact on job creation Technologies and their impact on job creation Trends most most likely to drive industry transformation and their expected impact job creation, ordered by net Technologies most most likely to drive industry transformation and their expected impact job creation, ordered effect (share of organizations surveyed) by net effect (share of organizations surveyed) Job creator Job displacer Net effect Global net effect Job creator Job displacer Net effect Global net effect Broadening digital access Augmented and virtual reality -100% +100% -100% +100% 64% 65% Increased adoption of new and frontier technologies Education and workforce development technologies -100% +100% -100% +100% 57% 65% Consumers becoming more vocal on social issues Big-data analytics -100% +100% -100% +100% 22% 55% Broader application of Environmental, Social and Governance (ESG) standards Encryption and cybersecurity -100% +100% -100% +100% 19% 50% Stricter government regulation of data use and technology Internet of things and connected devices -100% +100% -100% +100% -13% 50% Increased geopolitical divisions Digital platforms and apps -100% +100% -100% +100% -14% 45% Slower global economic growth Cloud computing -100% +100% -100% +100% -22% 35% Rising cost of living for consumers Text, image, and voice processing -100% +100% -100% +100% -29% 35% Role outlook Human-machine frontier Churn in five years Human-machine frontier 32% Five-year structural labour-force churn (percent) Tasks performed by humans and machines today and in 2027 (share of total) Global 23% Human Machine Industry Frontier Global Frontier Key roles for business transformation ALL TASKS Roles most selected by organizations surveyed (as either growing, stable or declining), ordered by net role growth, and their net growth and structural churn (percent) Now NET GROWTH INDUSTRY GLOBAL ROLES -50% 0 50% CHURN CHURN 67% 33% 2027 Forecast 45% 34% Data Analysts and Scientists 58% 43% 40% 24% Business Development Professionals Workforce strategy outlook 34% 26% Commercial and Industrial Designers Talent outlook in 2027 Expected change in talent availability, development and retention in the next five years (share of organizations surveyed) 54% 32% Graphic Designers Improving Worsening Global average Global average 37% 32% Digital Transformation Specialists Talent availability when hiring -100% +100% 20% 55% Advertising and Public Relations 37% 28% Professionals Talent development of existing workforce -100% +100% 0% 75% 17% 23% Application Developers Talent retention of existing workforce Business Services and Administration 48% 22% -100% +100% Managers 10% 70% 24% 25% Project Managers 9% 17% Authors and Journalists 38% 18% Lawyers 25% 19% Accountants and Auditors
 The Future of Jobs Report 2023 Page 216 Page 218