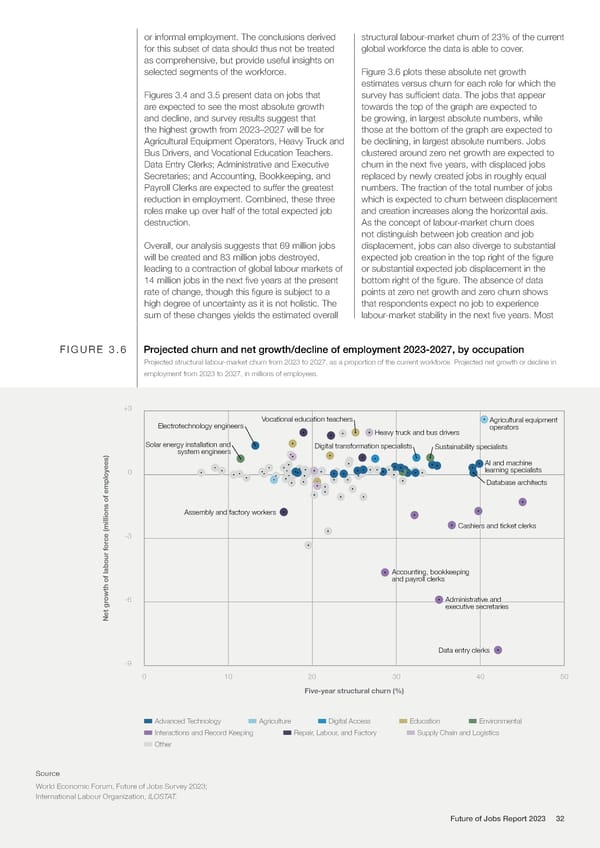
or informal employment. The conclusions derived structural labour-market churn of 23% of the current for this subset of data should thus not be treated global workforce the data is able to cover. as comprehensive, but provide useful insights on selected segments of the workforce. Figure 3.6 plots these absolute net growth estimates versus churn for each role for which the Figures 3.4 and 3.5 present data on jobs that survey has sufficient data. The jobs that appear are expected to see the most absolute growth towards the top of the graph are expected to and decline, and survey results suggest that be growing, in largest absolute numbers, while the highest growth from 2023–2027 will be for those at the bottom of the graph are expected to Agricultural Equipment Operators, Heavy Truck and be declining, in largest absolute numbers. Jobs Bus Drivers, and Vocational Education Teachers. clustered around zero net growth are expected to Data Entry Clerks; Administrative and Executive churn in the next five years, with displaced jobs Secretaries; and Accounting, Bookkeeping, and replaced by newly created jobs in roughly equal Payroll Clerks are expected to suffer the greatest numbers. The fraction of the total number of jobs reduction in employment. Combined, these three which is expected to churn between displacement roles make up over half of the total expected job and creation increases along the horizontal axis. destruction. As the concept of labour-market churn does not distinguish between job creation and job Overall, our analysis suggests that 69 million jobs displacement, jobs can also diverge to substantial will be created and 83 million jobs destroyed, expected job creation in the top right of the figure leading to a contraction of global labour markets of or substantial expected job displacement in the 14 million jobs in the next five years at the present bottom right of the figure. The absence of data rate of change, though this figure is subject to a points at zero net growth and zero churn shows high degree of uncertainty as it is not holistic. The that respondents expect no job to experience sum of these changes yields the estimated overall labour-market stability in the next five years. Most FIGURE 3.6 Projected churn and net growth/decline of employment 2023-2027, by occupation Projected structural labour-market churn from 2023 to 2027, as a proportion of the current workforce. Projected net growth or decline in employment from 2023 to 2027, in millions of employees. +3 Vocational education teachers Agricultural equipment Electrotechnology engineers operators Heavy truck and bus drivers Solar energy installation and Digital transformation specialists Sustainability specialists system engineers AI and machine 0 learning specialists Database architects Assembly and factory workers Cashiers and ticket clerks ce (millions of employees)-3 Accounting, bookkeeping and payroll clerks owth of labour for-6 Administrative and executive secretaries Net gr Data entry clerks -9 0 10 20 30 40 50 Five-year structural churn (%) Advanced Technology Agriculture Digital Access Education Environmental Interactions and Record Keeping Repair, Labour, and Factory Supply Chain and Logistics Other Source World Economic Forum, Future of Jobs Survey 2023; International Labour Organization, ILOSTAT. Future of Jobs Report 2023 32
 The Future of Jobs Report 2023 Page 31 Page 33