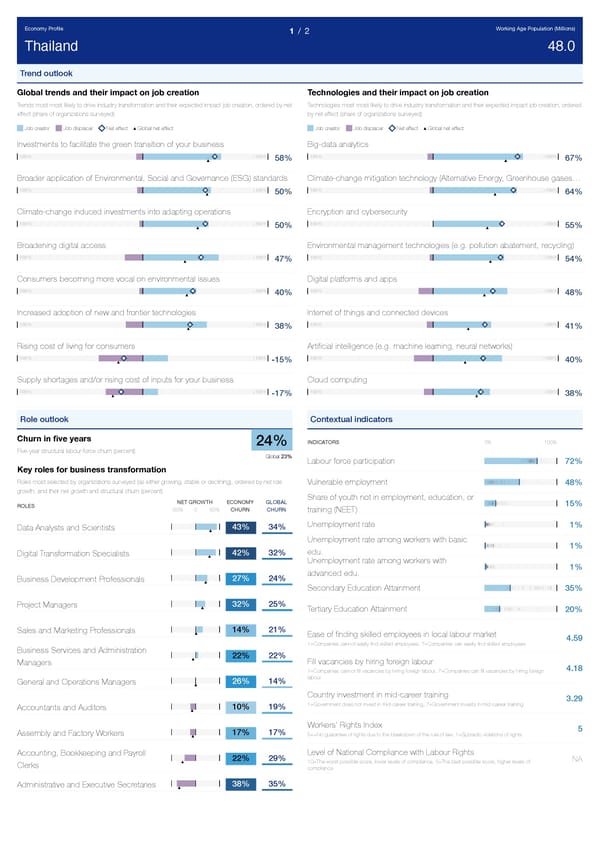
Economy Profile Working Age Population (Millions) 1 / 2 Thailand 48.0 Trend outlook Global trends and their impact on job creation Technologies and their impact on job creation Trends most most likely to drive industry transformation and their expected impact job creation, ordered by net Technologies most most likely to drive industry transformation and their expected impact job creation, ordered effect (share of organizations surveyed) by net effect (share of organizations surveyed) Job creator Job displacer Net effect Global net effect Job creator Job displacer Net effect Global net effect Investments to facilitate the green transition of your business Big-data analytics -100% +100% -100% +100% 58% 67% Broader application of Environmental, Social and Governance (ESG) standards Climate-change mitigation technology (Alternative Energy, Greenhouse gases … -100% +100% -100% +100% 50% 64% Climate-change induced investments into adapting operations Encryption and cybersecurity -100% +100% -100% +100% 50% 55% Broadening digital access Environmental management technologies (e.g. pollution abatement, recycling) -100% +100% -100% +100% 47% 54% Consumers becoming more vocal on environmental issues Digital platforms and apps -100% +100% -100% +100% 40% 48% Increased adoption of new and frontier technologies Internet of things and connected devices -100% +100% -100% +100% 38% 41% Rising cost of living for consumers Artificial intelligence (e.g. machine learning, neural networks) -100% +100% -100% +100% -15% 40% Supply shortages and/or rising cost of inputs for your business Cloud computing -100% +100% -100% +100% -17% 38% Role outlook Contextual indicators Churn in five years INDICATORS 0% 100% 24% Five-year structural labour-force churn (percent) Global 23% Labour force participation 72% Key roles for business transformation Roles most selected by organizations surveyed (as either growing, stable or declining), ordered by net role Vulnerable employment 48% growth, and their net growth and structural churn (percent) Share of youth not in employment, education, or NET GROWTH ECONOMY GLOBAL 15% ROLES -50% 0 50% CHURN CHURN training (NEET) Unemployment rate 1% 43% 34% Data Analysts and Scientists Unemployment rate among workers with basic 1% edu. 42% 32% Digital Transformation Specialists Unemployment rate among workers with 1% advanced edu. 27% 24% Business Development Professionals Secondary Education Attainment 35% 32% 25% Project Managers Tertiary Education Attainment 20% 14% 21% Sales and Marketing Professionals Ease of finding skilled employees in local labour market 4.59 1=Companies cannot easily find skilled employees, 7=Companies can easily find skilled employees Business Services and Administration 22% 22% Fill vacancies by hiring foreign labour Managers 4.18 1=Companies cannot fill vacancies by hiring foreign labour, 7=Companies can fill vacancies by hiring foreign labour 26% 14% General and Operations Managers Country investment in mid-career training 3.29 1=Government does not invest in mid-career training, 7=Government invests in mid-career training 10% 19% Accountants and Auditors Workers' Rights Index 5 17% 17% Assembly and Factory Workers 5+=No guarantee of rights due to the breakdown of the rule of law, 1=Sporadic violations of rights Level of National Compliance with Labour Rights Accounting, Bookkeeping and Payroll 22% 29% NA 10=The worst possible score, lower levels of compliance, 0=The best possible score, higher levels of Clerks compliance 38% 35% Administrative and Executive Secretaries
 The Future of Jobs Report 2023 Page 171 Page 173