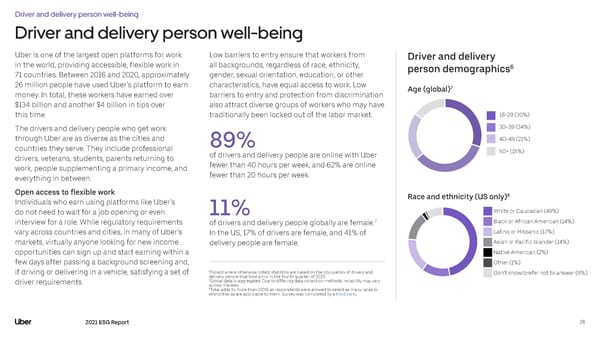
Driver and delivery person well-being Driver and delivery person well-being Uber is one of the largest open platforms for work Low barriers to entry ensure that workers from Driver and delivery in the world, providing accessible, flexible work in all backgrounds, regardless of race, ethnicity, 6 71 countries. Between 2016 and 2020, approximately gender, sexual orientation, education, or other person demographics 26 million people have used Uber’s platform to earn characteristics, have equal access to work. Low 7 money. In total, these workers have earned over barriers to entry and protection from discrimination Age (global) $134 billion and another $4 billion in tips over also attract diverse groups of workers who may have this time. traditionally been locked out of the labor market. 18-29 (30%) The drivers and delivery people who get work 30-39 (34%) through Uber are as diverse as the cities and 89% 40-49 (21%) countries they serve. They include professional of drivers and delivery people are online with Uber 50+ (15%) drivers, veterans, students, parents returning to fewer than 40 hours per week, and 62% are online work, people supplementing a primary income, and fewer than 20 hours per week. everything in between. Open access to flexible work 8 Individuals who earn using platforms like Uber’s Race and ethnicity (US only) do not need to wait for a job opening or even 11% White or Caucasian (49%) interview for a role. While regulatory requirements 7 Black or African American (14%) of drivers and delivery people globally are female. vary across countries and cities, in many of Uber’s In the US, 17% of drivers are female, and 41% of Latino or Hispanic (17%) markets, virtually anyone looking for new income delivery people are female. Asian or Pacific Islander (14%) opportunities can sign up and start earning within a Native American (2%) few days after passing a background screening and, Other (1%) 6 if driving or delivering in a vehicle, satisfying a set of Except where otherwise noted, statistics are based on the population of drivers and Don’t know/prefer not to answer (8%) delivery people that took a trip in the fourth quarter of 2020. 7 driver requirements. Global data is aggregated. Due to differing data collection methods, reliability may vary across markets. 8 Total adds to more than 100% as respondents were allowed to select as many races or ethnicities as are applicable to them. Survey was completed by a third party. 2021 ESG Report 28
 Uber ESG Report Page 27 Page 29